Hard Work, Risk-Taking, and Diversity in a Model of Collective Problem Solving

and
University of California Merced, United States
Journal of Artificial
Societies and Social Simulation 24 (4) 10![]()
<https://www.jasss.org/24/4/10.html>
DOI: 10.18564/jasss.4704
Received: 17-Apr-2021 Accepted: 12-Oct-2021 Published: 31-Oct-2021
Abstract
We studied an agent-based model of collective problem solving in which teams of agents search on an NK landscape and share information about newly found solutions. We analyzed the effects of team members’ behavioral strategies, team size, and team diversity on overall performance. Depending on the landscape complexity and a team’s features a team may eventually find the best possible solution or become trapped at a local maximum. Hard-working agents can explore more solutions per unit time, while risk-taking agents inject randomness in the solutions they test. We found that when teams solve complex problems, both strategies (risk-taking and hard work) have positive impacts on the final score, and the positive effect of moderate risk-taking is substantial. However, risk-taking has a negative effect on how quickly a team achieves its final score. If time restrictions can be relaxed, a moderate level of risk can produce an improved score. If the highest priority is instead to achieve the best possible score in the shortest amount of time, the hard work strategy has the greatest impact. When problems are simpler, risk-taking behavior has a negative effect on performance, while hard work decreases the time required to solve the problem. We also find that larger teams generally solved problems more effectively, and that some of this positive effect is due to the increase in diversity. We show more generally that increasing the diversity of teams has a positive impact on the team’s final score, while more diverse teams also require less time to reach their final solution. This work contributes overall to the larger literature on collective problem solving in teams.Introduction
Teams can often search for solutions more effectively and efficiently than individuals working alone. Businesses and other institutions devote tremendous amounts of resources to source and train talent in order to build problem-solving teams (Pessima & Dietz 2019; Society for Human Resource Management (SHRM) 2016; Tansley et al. 2006). Collective problem solving is of interest to researchers across many disciplines, including organizational psychology, economics, computer science, behavioral ecology, complexity science, and management. Many roles, including positions in research and management historically performed by sole individuals, are increasingly being conducted by groups (Gowers & Nielsen 2009; Richard Hackman 2002; Wuchty et al. 2007).
An important line of inquiry in the study of collective problem solving is the identification of characteristics that enhance a team’s performance (Brownell et al. 2020; Hagemann & Kluge 2017; Woolley et al. 2010), and how those characteristics interact with factors such as the complexity of the problem being solved (Lazer & Friedman 2007; Yahosseini & Moussaïd 2020). These characteristics might include the extent to which the individual team members are hardworking (and therefore might generate more solutions per unit time) or risk taking (and therefore might generate more creative and less obvious solutions), as well as the overall size and diversity of the teams. Diversity in particular has been suggested to enhance team performance. Grouping individuals with different ideas and perspectives has been found to generate new knowledge and thus better performance (Gomez & Lazer 2019; Lorenz et al. 2011; Smith & Hou 2015). These effects are rooted in the power of cognitive diversity, which directs different points of views and interpretations toward problem solving (Gomez & Lazer 2019; Page 2008, 2019). We use agent-based modeling to study the impact of hard-working and risk-taking individuals on team performance on both simple and complex tasks. We also study the roles of team size and diversity. Our results indicate that when a team needs to solve complex tasks, both hard-working and risk-taking agents can improve the quality of a team’s output while the effect of taking risk is more substantial. However, while hard working agents save time, risk-taking agents can dramatically increase the time needed for a team to find a quality output. Our results also support research indicating that diversity can be beneficial to team performance.
Operationalizing problem complexity
Teams face problems of varying complexity levels. Many of the problems teams face in the fields of science, entrepreneurship, business, and management are quite complex, which means that a solution is likely to involve many interdependent decisions that must be simultaneously optimized. In other words, a change to one decision might yield either positive or negative results based on the other concurrent decisions (Levinthal & March 1981; Siggelkow & Levinthal 2003). Simpler problems, in contrast, are often characterized by fewer interdependencies, so that each decision can be treated more or less independently of the others.
To capture the differences in interdependencies between simple and complex problems, we operationalize the space of problem solutions as an NK landscape (Kauffman & Weinberger 1989; Lazer & Friedman 2007). An NK landscape is determined by two parameters, unsurprisingly denoted \(N\) and \(K\). \(N\), the number of problem dimensions, can be interpreted as the number of activities (e.g., behaviors, technologies) a solution could involve, each of which could be present or absent. \(K\) is the level of interdependency between these activities. A solution is characterized by the presence of a particular set of activities, and each solution has an associated “score,” which is interpreted as its quality. Each solution can be viewed as a location on the \(N\)-dimensional landscape. When \(K\) is close to zero, the problem is simple, because the contribution of each activity to the solution quality can be independently assessed. Increasing \(K\) makes the problem space more complex, because the contribution of any given activity depends on the presence or absence of \(K\) other activities. When \(K = N – 1\), the space has maximal entropy, because solutions contain no information about adjacent solution, so “complex” problems are usually defined by intermediate values of \(K\).
The NK landscape was originally developed to study the complex combinatorial search involved in evolutionary dynamics (Kauffman & Weinberger 1989). The model has been used by biologists to study development in epistatic gene networks (Schank & Wimsatt 2012), genomic coevolution (Kauffman & Johnsen 1991), and immune system maturation (George & Gray 2000). Locations on the landscape represent genomic fitness in these models, whereby the parameter \(K\) determines the ruggedness of the fitness landscape. A complex problem landscape is rugged and contains many good locations (“peaks”) separated by low-score “valleys.” Lower interdependency between dimensions makes a problem simpler, represented by a smoother landscape. The model is quite versatile and has been widely adopted in other fields, including economics (Khraisha 2020), management (Westhoff et al. 1996), and political science (Shugars 2020). The subject of collective problem solving has been widely studied through the use of the NK model (Barkoczi & Galesic 2016; Lazer & Friedman 2007; Shore et al. 2015; Yahosseini & Moussaïd 2020), so that team’s aim is to find the highest peak in the landscape in the shortest amount of time. A number of previous studies have used the NK landscape model to study the factors that impact a team’s success in collective problem solving, focusing on aspects such as problem complexity (Lazer & Friedman 2007; Levinthal 1997; Rivkin 2000), communication network structure (Fontanari 2016; Lazer & Friedman 2007), landscape exploration strategies (Chao & K. 2008; Yahosseini & Moussaïd 2019), and diversity (Gomez & Lazer 2019). For example, Lazer & Friedman (2007) studied the communication connectivity level and showed that sparse communication networks could be more effective in solving complex problems, because they allowed teams to maintain a diversity of solutions for longer. Yahosseini & Moussaïd (2020) investigate different landscape exploration strategies and found that the approach of tackling problems sequentially (like a relay race) is more effective when the problem is simple. For complex problems, teams of independent individuals who tackle the problem independently and then choose the optimal solution tend to perform better.
In our model, we focus on the effect of the agent’s behavior in the exploration of the landscape. Several studies have designed different exploration strategies and measured the effect of each strategy on team performance. Exploration strategies can traditionally be categorized into two main categories: adjacent search and big jump search (Baumann et al. 2019). For example, Chao & K. (2008) shed light on the appropriate “balance” between adjacent search and big jump search in a new product-development portfolio. The result showed that environmental instability shifts the balance toward adjacent search strategy, while as the environment becomes more complex, the balance should shift toward a big jump search. The exploration strategies investigated in our work include the generation of different numbers of solutions per unit time by an agent (multiple adjacent search) and the generation of solutions that are very different from the current solution of the agents (big jump search).
While previous studies have investigated different search strategies, including big jump search and adjacent search, we did not find any study that investigated variation in the extent to which those search strategies were implemented. We filled this gap by investigating the effect of different adjacent and big jump search levels on team performance when teams face simple and complex problems. We have also created agents that can combine both adjacent and big jump search strategies and investigated how those agents affect team performance. We investigated the effect of team size on the performance of both search strategies. In addition to the exploration strategy, we studied the effect of diversity on team performance. We have also studied the effect of background knowledge and search behavior diversity on team performance. Although previous research has investigated the effect of different types of diversities on team performance, including functional diversity (Hong & Page 2004), ability and knowledge diversity (Gomez & Lazer 2019), and skills diversity (Horwitz & Horwitz 2007), they ignored addressing the effect of search behavior strategies diversity on the performance of a team of problem solvers. We fill this gap by comparing diverse teams’ performance that includes both hardworking and risk-taking agents with non-diverse teams. Another type of diversity that we addressed in our work is the background knowledge diversity of team members. To our best knowledge, no study has been conducted to investigate the effect of teams’ background knowledge on teams’ performance with different search strategies. We studied the effect of teams’ background knowledge on the time it takes for teams to reach their final solution, which has never been addressed before.
In our model, as in previous studies of collective problem solving on NK landscapes, individuals search the landscape independently and communicate with each other and share solutions. An individual will adopt someone else’s solution if it is demonstrated to be superior to their own.
Working hard, taking risks, and diversity
This paper takes the perspective of a manager hoping to assemble a team that can work together to solve challenging problems, understanding that some problems may be more complex than others. We focus on teams made up of agents who exhibit different levels of hard work and risk-taking and compare their performance in solving both simple and complex problems.
Creativity and working hard are among the factors that determine team performance (Suh & Shin 2008). Creativity is considered as taking risks and generating new ideas (Amabile et al. 1996). For example, when an organization encourages its employees to take risks and work creatively, the employees produce uncommon useful ideas which lead to better results (Amabile et al. 1996; Suh 2002). Taking risks generates successful innovations that have a huge impact on team performance (Wang & P. 2010).
Working hard is positively related to team performance (Brown & Leigh 1996; Holmes & S. 2002) and is one of the highly anticipated behaviors of employees working at organizations. Hardworking behavior is related to factors including work ethic, morality, gender, marital status, and education (Elçi et al. 2011). Some studies recognize hardworking employees based on the number of hours that they work (Tremblay 2002) while other studies consider hardworking as expending great effort on a task (Elçi et al. 2011; Miller et al. 2002). Therefore, in a fixed amount of time, a hardworking employee is the one who completes more jobs.
For our baseline problems, we assume, as do previous authors, a process of local search in the landscape. That is, they add or subtract one activity at a time and assess the effect of their change on the quality of their solution. Hardworking agents are assumed to search the landscape in an identical manner, but more efficiently. That is, they can assess more solutions per unit time. This type of individual learning, which involves the avoidance of large jumps in the landscape, may be considered risk averse (Frey et al. 2017), or at the very least uncreative. In contrast, we also consider risk taking agents. “Risk” is generally considered a multidimensional construct (Renn 1998) that can involve high levels of uncertainty regarding the link between actions and outcomes (Dietz et al. 1996). Risky behaviors involve the possibility of positive reward but a high probability of substantial loss (Nigg 2017). We consider risk taking behavior in problem solving as a large move in problem space the simultaneous addition or deletion of several activities at once. Such a move may also be considered in terms of creativity: the ability to consider a solution “outside the box.” Empirical studies have indicated that people’s desire to take risks is reduced when a problem space becomes more complex (Lorenz et al. 2015; Yahosseini & Moussaïd 2019). In this study, we aim to learn whether risk averse behavior when an individual faces complex problems is beneficial or not.
Foley & Riedl (2015) studied the effect of risk taking on team performance using an NK landscape with different social network topologies. They found that although many agents converge to local maxima when they are in an efficient communication network structure, increased levels of risk-taking helps agents escape from local maxima and leverage the benefits of efficient communication without converging on local maxima. However, as risk-taking agents jump to more distant areas of landscape rather than practicing hill climbing, their performance is impaired, especially when they use a less connected communication network.
In addition to studying teams composed solely of hard working or risk-taking agents, we also consider hybrid teams consisting of a mix of individuals, as well as hybrid individuals who exhibit both hard working and risk-taking characteristics.
Finally, we consider the impact of diversity on team performance by exploring how variation in background knowledge and search behavior within a team contributes to a team’s problem-solving performance. Diversity has been determined as an important factor for the success of collective behaviors (Aplin et al. 2014; Santos et al. 2012). More specifically, the cognitive diversity which refers to variety in perspectives and methods of approaching problems usually lead to a superior result (Page 2008). There are several modeling studies that investigate the effect of diversity on team performance using the NK landscape. For example, Fontanari (2016) defined different types of agents based on their propensity toward social learning and compared the performance of homogeneous heterogeneous teams. The type of diversity that we addressed in our work is about the background knowledge and search behavior diversity of team members. Following Gomez & Lazer (2019), we define the background knowledge of an agent as its initial solution in solution space in our agent-based simulations. Teams with diverse background knowledge will have a wide range of initial solutions among their members, while more homogeneous teams will have initial solutions that are highly correlated among the team’s members.
We studied two types of search behaviors in our study: hardworking and risk-taking search behavior. A team with search behavior diversity contains both hardworking and risk-taking agents in the team. We compared the outcome of diverse teams with the outcome of different non-diverse teams.
Model
The collective problem-solving process is modeled as a search on a smooth or rugged NK landscape implemented by a team of networked agents. Agents continue to search for solutions with higher scores than their current solution. During the simulation, agents explore the landscape and communicate their current solutions with their network ties. An agent always employs one solution (a location on the landscape) and is assumed to know the value of that solution and be able to communicate it to others. Multiple agents can simultaneously employ the same solution.
Agents’ communication network is a ring lattice with degree four. This type of modestly-connected network structure facilitates effective problem solving for both simple and complex problems. Previous research has shown that when facing simple problems, teams that communicate using a fully connected network reach to the global maximum much faster (Lazer & Friedman 2007) while the excessive connectivity can reduce the team performance on complex problems (Fang et al. 2010; Lazer & Friedman 2007). Agents are assumed to communicate with full transparency and share information without error and without cost.
Each solution is represented as an \(N\)-dimensional binary vector, with a corresponding score (see below for details). At the beginning of each simulation run, each agent is randomly assigned an initial solution. The simulation unfolds in discrete time steps, during which each agent, in random order, considers whether to adopt a new solution using either social or individual learning. In the remainder of this section we describe each aspect of our model in detail.
Agent behavior
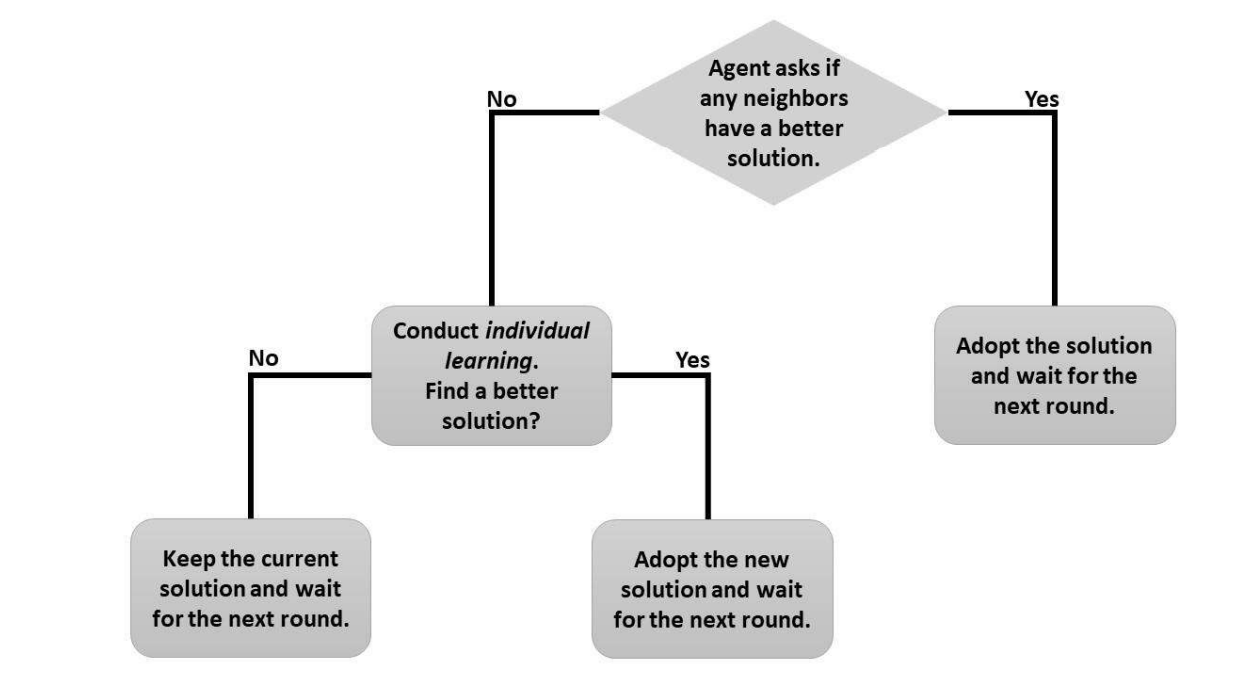
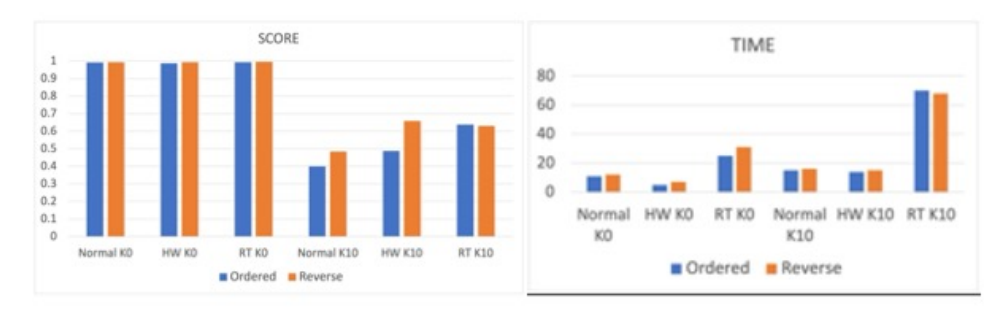
Agents use a strategy of conditional social learning, adopting the solution of others if it is demonstrably better than their own solution, and relying on individual learning otherwise. This learning strategy has been shown to be adaptive under a wide range of scenarios (Ehn & Laland 2012). At each time step, an agent compares the score of its current solution to those of its network neighbors (social learning). The agent then adopts the solution with the highest score if it is better than its own current solution. In the case that none of its neighbors has a better solution, the agent engages in individual learning to consider one or more new solutions. It adopts a new solution if that solution is better (has a higher score) than its current one, otherwise it retains the solution it employed at the beginning of the time step (see Figure 1). A major advantage of using social learning is to avoid the costs of conducting individual learning. This is why in our model, agents learn from each other (social learning) first and if they fail, they try individual learning. We have also done a sensitivity analysis to compare the ordered model (first social learning and then individual learning) with reverse-ordered models. The results summarized below and presented in detail in the Appendix.
Agents employ one of several behavioral strategies for individual learning related to hard work and risk taking (Figure 2).
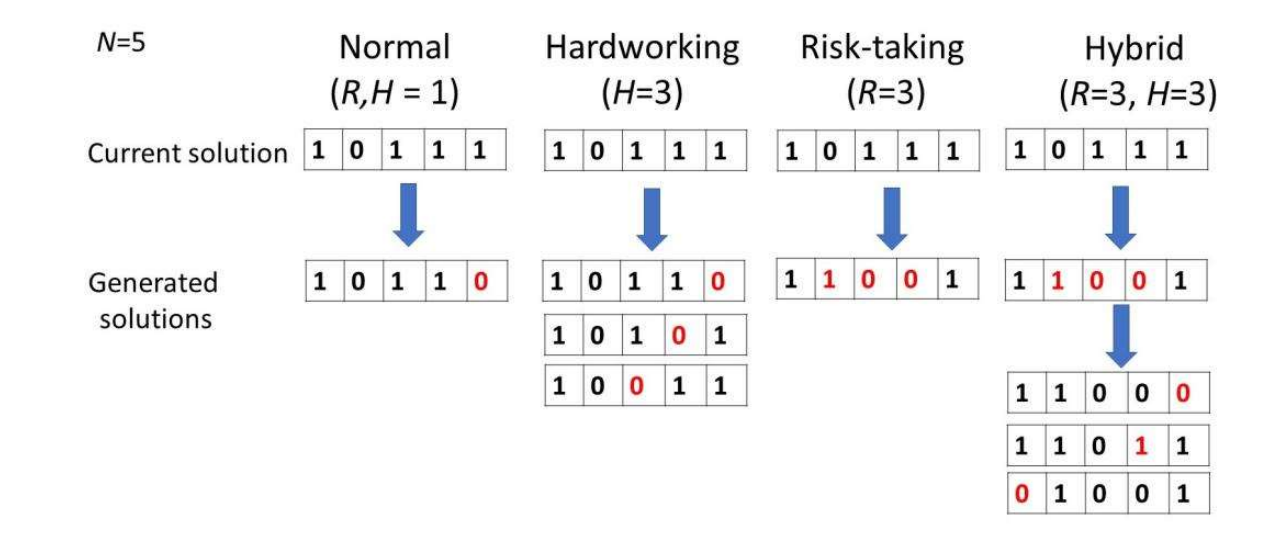
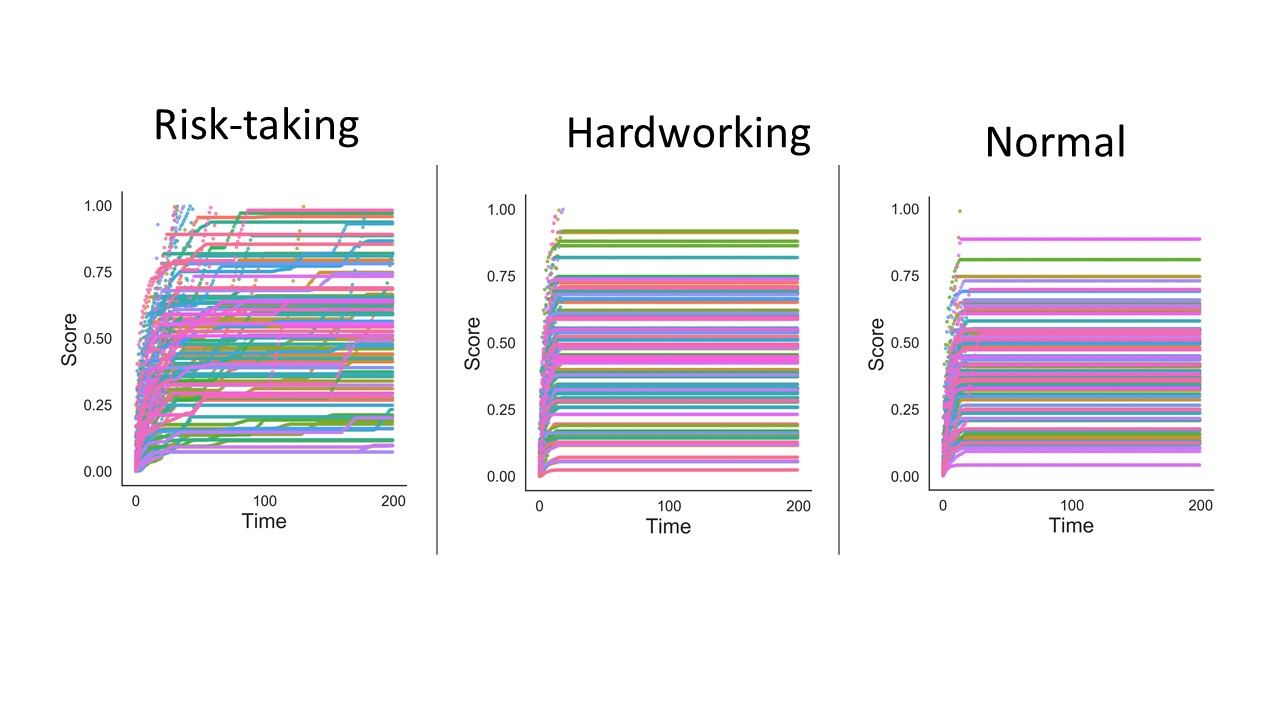
Hardworking agents: Hardworking agents explore the landscape by checking several of their immediate adjacent locations, altering one element of their current \(N\)-dimensional solution several times. In other words, they generate multiple solutions that each have a Hamming distance of 1 from the agent’s solution at the beginning of the time step. The number of new solutions that a Hardworking agent generates in each time step is the agent’s hardworking level, \(H > 1\). At each time step, a hardworking agent examines the scores associated with each of the new solutions, compares them against one another and with their current solution, and selects the solution with the highest score.
Risk-taking agents: A risk-taking agent generates a new solution to consider by making a certain number of simultaneous changes to its’ current solution. These agents compare the new solution with their current one and adopts the solution with the higher score. In other words, a risk-taking agent generates only one new solution, but with a Hamming distance of greater than one from its current solution. In this way, these agents are able to explore relatively distant locations in the landscape. The risk-taking level of a risk-taking agent, \(R > 1\), refers to the number of binary elements that an agent flips in generating its new solution.
Normal agents: In each individual run, a normal agent explores the landscape by selecting exactly one element of its solution and altering it, comparing the newly generated solution to its current solution and adopting whichever has a higher score. In other words, a normal agent is defined by \(H = R = 1\).
Hybrid agents: Hybrid agents are both hardworking and risk-taking (so that \(H > 1\) and \(R > 1\)). In each individual learning run, they take a large jump (similar to risk taking agents) and then explore several locations adjacent to their jump destination (similar to hardworking agents).
A team eventually converges so that all agents reach agreement at the best solution its members have found. Due to random exploration, risk-taking agents will eventually find the global optimum, but this can take an arbitrarily long amount of time. To model more realistic conditions under which agents would eventually have to settle on a “good-enough” solution, we implemented a stopping time. Simulations ended when either (A) a team reached the global maximum (the best possible solution) or (B) 200 time steps had elapsed. Under almost all the conditions we considered, teams converged on their final score well before 200 time steps (see the Appendix). We can thus consider the time required for teams to reach their final score as a measure of search efficiency.
The NK landscape
This section explains how a score is assigned to a solution in the NK landscape. It is worth emphasizing that this is an oft-used modeling paradigm, and the algorithm described here is not unique to our model (see Csaszar 2018 for a helpful primer on NK landscapes). Each solution element is a binary value, and thus, there are \(2^{N}\) possible solutions on the landscape. Two locations in the landscape are defined as adjacent if their associated solutions differ by exactly one element (that is, their Hamming distance is 1). Each solution is assigned a solution score at the beginning of every simulation run, which remains fixed throughout the duration of the simulation. In the case of no interdependency (\(K = 0\)), the contribution of each solution element to the solution score is independent and only relies on its own state (0 or 1). Otherwise, the contribution of each element depends on its own state (0 or 1) as well as the states of \(K\) other elements (randomly selected and fixed for the duration of the run) when there are dependencies (\(0 < K < N\)). In this study, we fixed the dimensionality at \(N = 20\), and considered simple problems with K = 0 and complex problems with \(K = 10\).
A solution can be represented as a vector thusly:
| \[ \mathbf{S} = [s_{1}, s_{2}, \dots s_{N}], s_{i} \in \{0,1\}\] | \[(1)\] |
To compute the score of each solution, we created an interdependency vector (\(\mathbf{V_{i}}\)) for each solution element si at the beginning of each simulation. Each interdependency vector contains the solution element and the \(K\) other elements on which it is interdependent (these are randomly assigned at the beginning of each simulation). In the case of no interdependency (\(K=0\)), each interdependency vector contains only one element (the solution element).
The score of each interdependency vector determines the contribution value of a solution element. To compute the score of an interdependency vector (\(\mathbf{V_{i}}\)), we treated the consecutive elements of the vector like a number in base 2 and then converted that to a number in base 10. This number represents the position index in the score list. The score list is a list of random numbers generated at the beginning of each run from a uniform distribution in the range of 0 to 1000. The value that was selected (by the position index) from the score list is the score of each interdependency vector.
For example, considering \(N=5\) and \(K=2\), an example solution could be \(\mathbf{S} = \{1,0,1,1,0\}\). If the first element is randomly assigned interdependency on elements 2 and 5, then the interdependency vectors for the first element would be:
| \[ \mathbf{V_{1}} = \{1,0,0\}\] | \[(2)\] |
In our example, \(\mathbf{V_{1}} = 100\). We next convert 100 into a number in base 10 and obtain 4. If the score list for our simulation is \(\{12,20,70,55,33,14,7,11\}\), the score contribution for the first element of the solution is element 4 of the score list (with indices starting at zero), which is 33 in this case.
To compute the total score of a solution, we take the average scores of all interdependency vectors of a solution. In accordance with prior work (Barkoczi & Galesic 2016; Lazer & Friedman 2007), we raised all scores to the power of 8 to widen the score distribution and better distinguish high scores from lower scores. To allow comparison of scores across simulation runs, we normalized the scores in [0, 1], with one being the highest possible score in a given run.
Diversity
Each agent was initialized with a random problem solution (a location on the NK landscape). We operationalized team background knowledge diversity, \(D\), as the number of unique (randomly generated) solutions from which agents were initialized, so that \(D\) could vary between one and \(n\). We assumed that less diverse teams shared backgrounds, and therefore would begin to tackle a problem using similar initial solutions (even though their subsequent search in problem space was uncorrelated). We first generated \(D\) seed agents, each assigned to a random initial solution. Then we created \(n/D - 1\) copies of each seed agent, where \(n\) is the total team size. When \(D\) is large the team is highly diverse, since a higher number of agent’s initial solutions is independent of the other team members. A minimally diverse team occurred when \(D\) is minimum, since most agents started with the similar solution.
The other type of diversity that we have studied is search behavior diversity. The search behaviors we have studied in this work are hardworking, risk-taking, and hybrid search strategies. Non-diverse teams contain only one type of agent (either risk-taking, hardworking, or hybrid agents). However, diverse teams contain more than one type of agent. We have compared the performance of diverse teams with non-diverse teams.
Experiments and Results
For the solution space, we used a landscape of \(N = 20\). Unless otherwise stated, all teams had n = 100 agents. For hard-working and risk-taking teams, we varied the levels of the H and R traits from 1 (normal) to 20. We considered team performance in terms of both maximum score and the time to reach that score, for both simple (\(K = 0\)) and complex (\(K = 10\)) problems. We repeated all simulations 100 times and considered the mean of the final score and final time as the simulation outcome. Simulations terminated when a team reached the global maximum or after 200 time steps. NetLogo code for the model is available in: https://www.comses.net/codebases/4ff8683a-50e0-4c05-bda0-0c69f1dd63f9/releases/1.0.0/.
Individual characteristics
The impact of hardworking agents on team performance
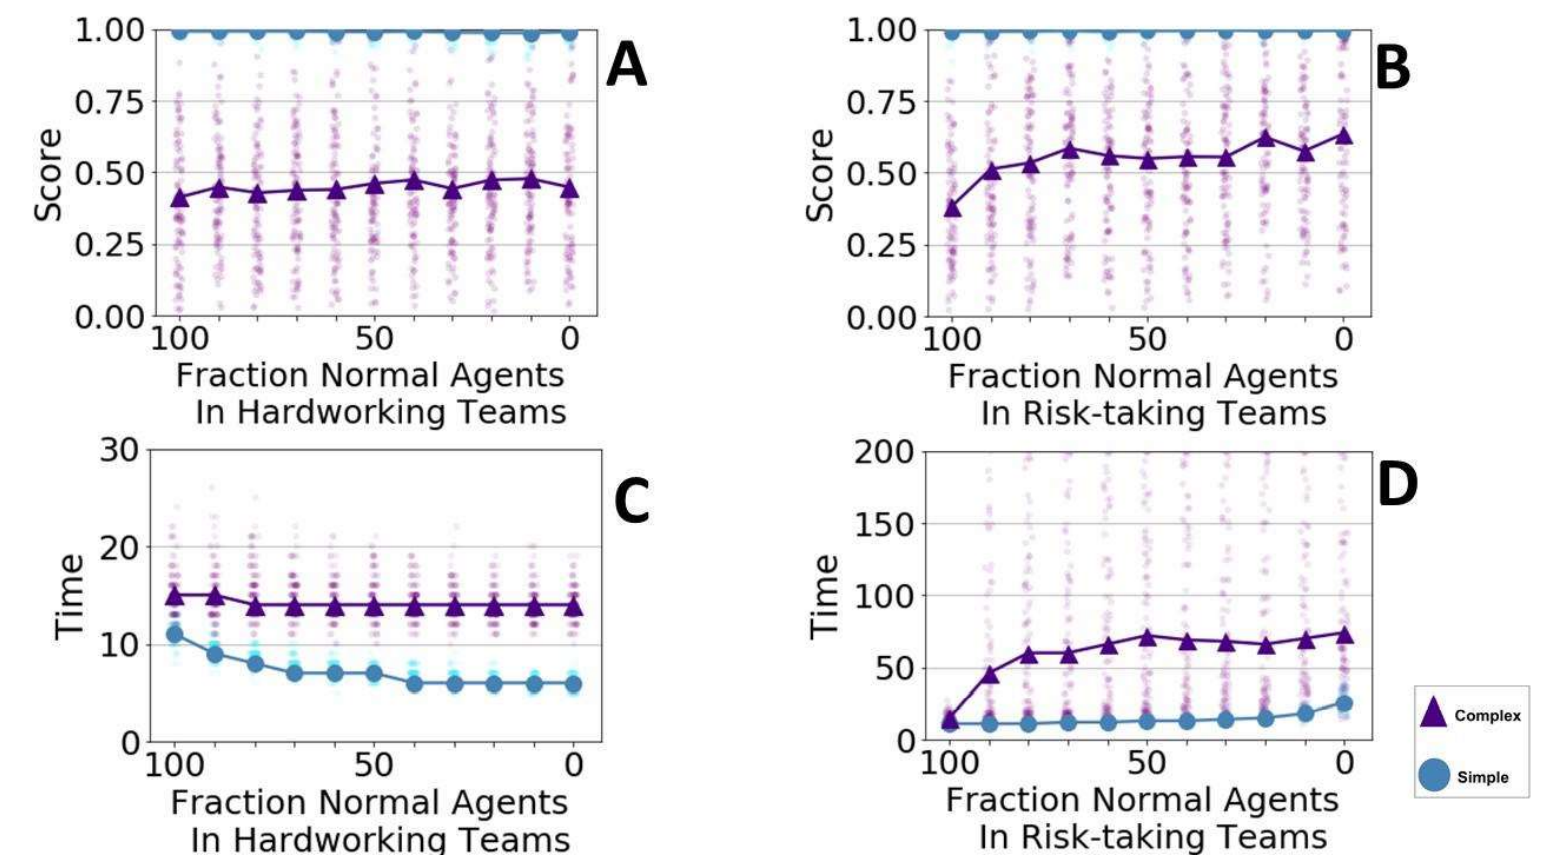
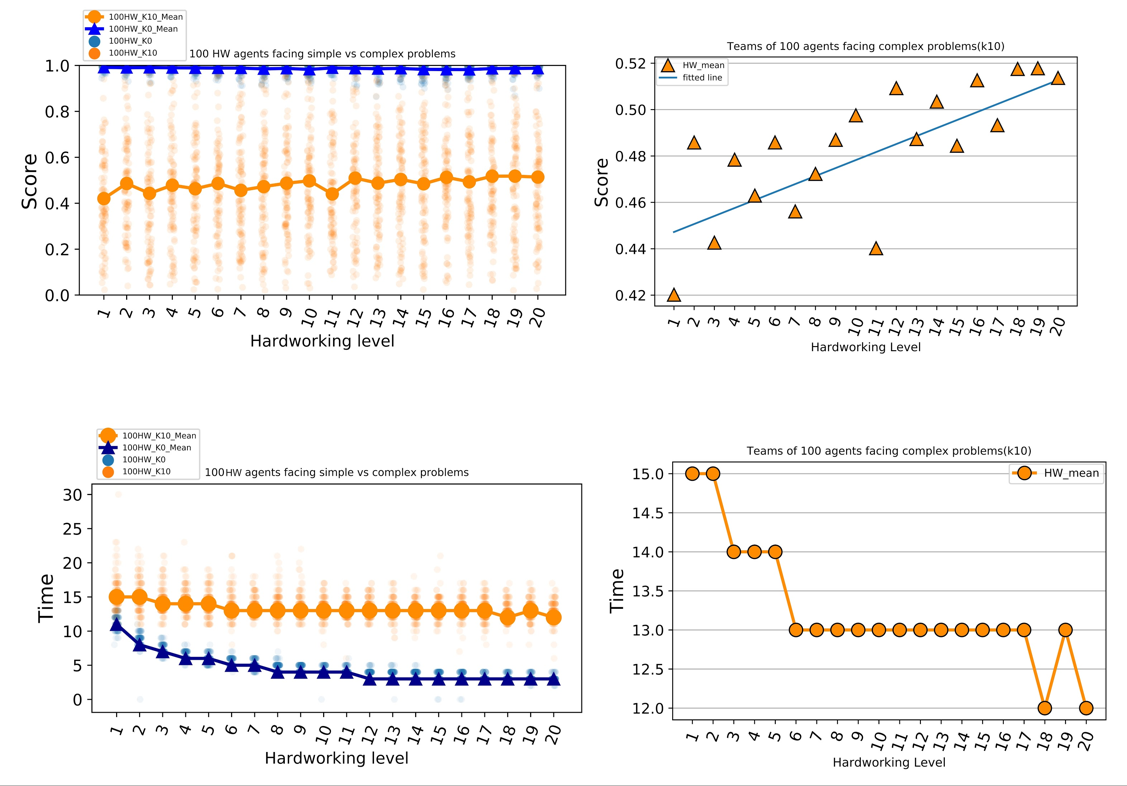
Increasing a team’s \(H\) level makes the team faster and slightly increases the team’s final score (Figure 3 A & C). Increasing the \(H\) level 20-fold improved the final score, increasing it from 0.42 to 0.52 in a scale of zero to one. Although these effects are positive, they are very weak. The drop from simple to complex problems causes a massive drop in solution score, and even \(H = 20\) is able to recover only a small amount of that loss. When teams are large enough, even a team with the lowest \(H\) level (normal agents) can reach the global maximum in response to a simple problem. However, when \(H\) levels are increased, teams require less time to reach their final solution (Figure 3 C). Other than increasing the H level of the team, replacing team members with more hardworking ones slightly improves team score. Also, the time that it takes for a team to reach its final outcome decreases as the number of hardworking agents (\(H\) level of 5) increases in a team (Figure 4 C).
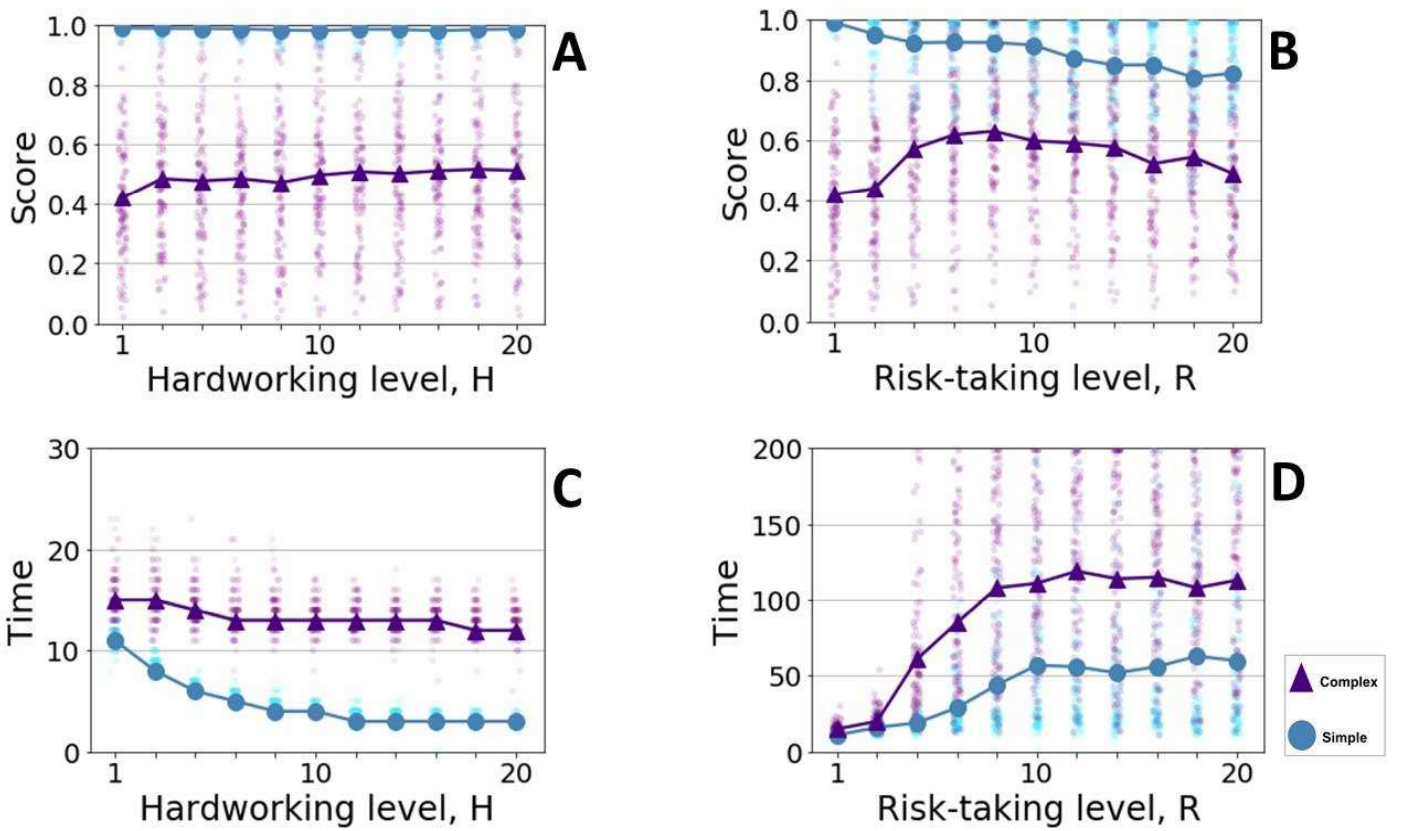
Risk-taking teams explore the landscape through a much wider approach. They might become stuck in a hillside or a local maximum for a while looking for a more elevated location, but they eventually escape from it. They usually find a better solution, which allows the simulation to run for a longer time and enables the agents to continue exploring. It is worth mentioning that as risk-taking agents conduct random explorations, they eventually rise from any plateau and find a global maximum; however, this process can take an arbitrarily long time. In this study, the simulation was restricted from persisting for more than 200 time steps.
In addition to addressing the effect of different levels of \(R\) on team’s performance, this study also examines the impact of increasing the number of risk-taking agents on team performance. To this end, we replaced different numbers of normal agents (\(R=1\)) with risk-taking agents with \(R\) level of five (\(R=5\)) in a team of 100 normal agents (Figure 4 B & D).
The simulation results indicate that increasing the number of risk-taking agents in a team increases the final score when teams face complex problems. In the context of simple problems, teams with different numbers of risk-taking agents are able to find the global maximum, however, increasing the number of risk-taking agents increases the required time for a team to reach its final solution. Increasing the number of risk-taking agents in a team, increases the time it takes for a team to reach their final solution in the contexts of simple and complex problems.
Risk-taking agents vs. hardworking agents
In the context of a complex problem, both having more risk-taking and hardworking agents in a team has a positive effect on the team’s score. However, the effect of having more risk-taking agents is more substantial. Hardworking agents are more likely to become trapped in the local maximum because they simply explore their local environment. In comparison to risk-taking teams, hardworking teams usually reach a relatively lower score. As a result, they take less time to reach their final solution. In general, in the context of a complex problem, taking risks has a positive effect on team score. Hardworking agents have a slightly positive effect on team score and decreased the required time for a team to reach the final solution. In the context of simple problems, all teams are able to reach the global maximum. However, having more hardworking agents in a team helps a team reach the final solution faster, and having more risk-taking agents in a team makes the team reach the global maximum in a greater amount of time.
Hybrid agents
The teams of hybrid agents express better performance in comparison to teams of normal, hardworking, and risk-taking agents. Score improvement can be attributed to the contribution of both hardworking and risk-taking characteristics in hybrid agents behavior. Requiring less time can be attributed to the hardworking part of hybrid agents; a hybrid team becomes faster when the H level of the hybrid agents is increased.
Almost all of the teams are able to reach the global maximum when they face simple problems. The only teams that are not able to reach the global maximum are risk-taking teams with higher levels of \(R\) (\(R=10\)). This is because they take unnecessary large jumps, which does not help them find the global maximum in a reasonable amount of time. As teams become more hardworking, they reach the global maximum of simple problems faster. Increasing the level of \(R\) thus has a negative effect on required time for teams to converge to a solution (Figure 5).

Team characteristics
Team size
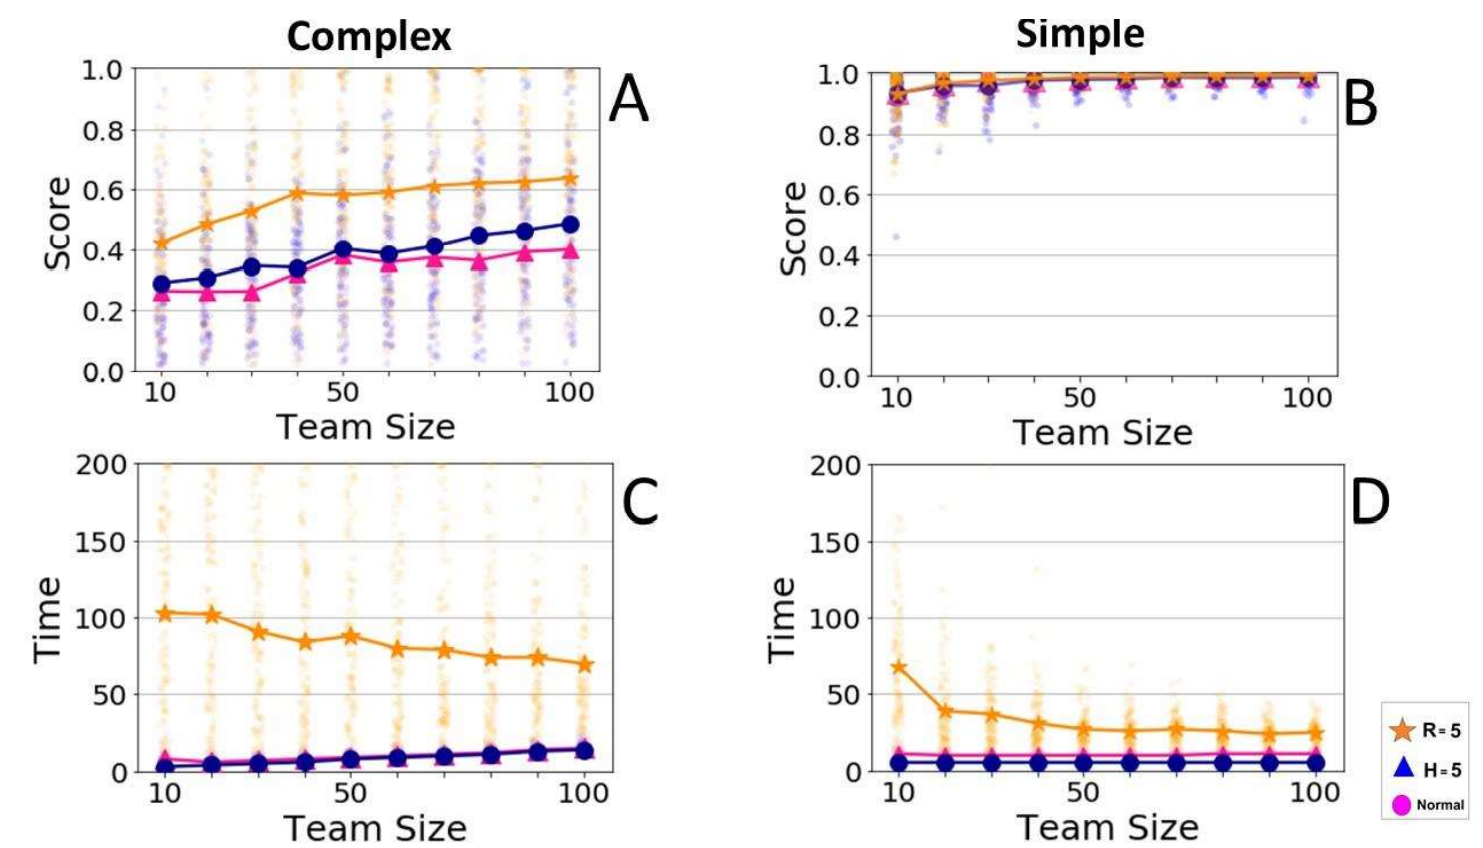
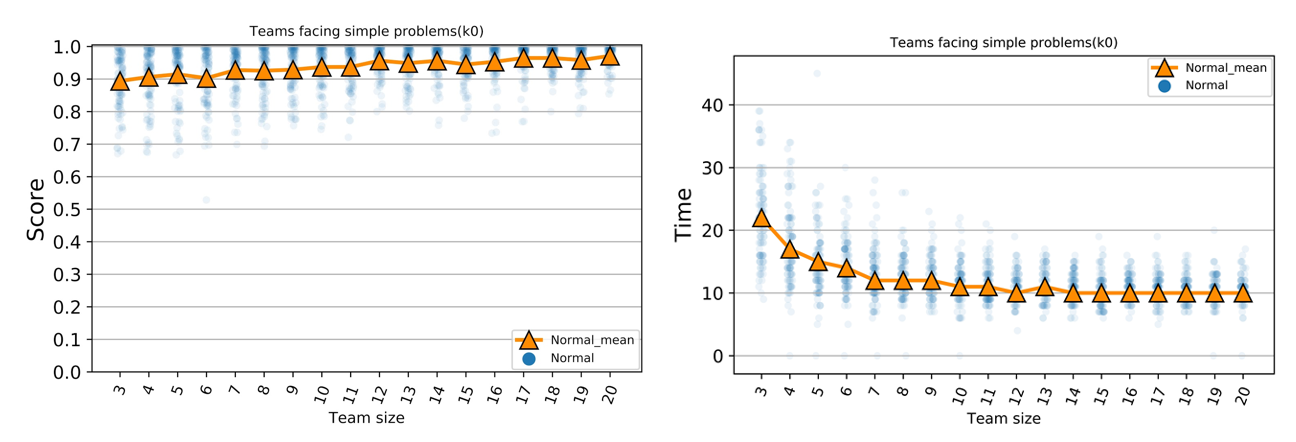
Increasing team size improves the team score (Figure 6 A & B). This is because the higher the number of agents in a team, the more of the landscape they are able to explore. As a result, larger teams are able to find peaks with higher scores.
Increasing team size increases the time it takes for the normal and the hardworking teams to find their optimal solution, but it decreases the time for risk-taking teams (Figure 6 C). One reason for this result is that it takes a larger team longer to converge to a lower number of solutions. Converging plays a crucial role in a team’s determination of a final solution for teams that don’t take risks such as normal and the hardworking teams. Team members in such teams explore their immediate adjacent locations in the landscape. When they converge to a limited number of locations due to social learning, their final location is the most elevated peak among those limited locations and their instant adjacent locations. Enlarging a team, increases the number of solutions that are possible to be explored by teams that don’t take risks. The teams’ score gradually improves when risk averse teams explore the landscape. Therefore, it takes longer for them to reach their final output. However, for a risk-taking team, the convergence does not limit the individual learning to local areas. Therefore, converging does not play an important role in risk-taking teams’ identification of their final solution. Also, risk-taking teams can potentially explore the entire landscape regardless of the current solution of its agent. They take large steps and their score improvement pattern is not necessarily gradually. Enlarging a risk-taking team increases the probability of reaching a better solution faster.
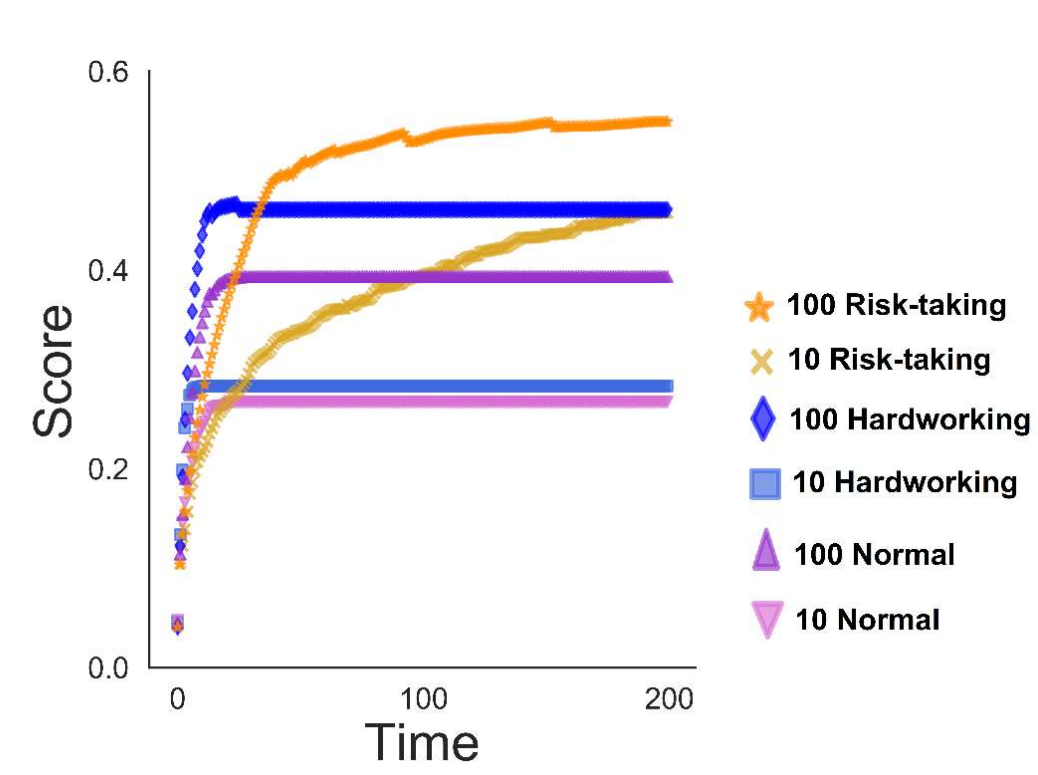
The time it takes for teams with different sizes to reach their final solution is related to how widely they can explore the landscape in a given amount of time. Although in comparison to smaller teams, larger teams reach higher scores, for any given score that both smaller and larger teams are capable of reaching, larger teams reach that score earlier than smaller teams (Figure 7). The amount of time that risk-taking teams need to reach their final solution is substantially greater than that of teams that don’t take risks, partly because the former are less likely to get stuck on local maxima and continue to explore the landscape. More importantly, risk-taking teams usually reach a substantially higher score in the long run. This indicates that if a high score needs to be achieved in a short amount of time, a hardworking team is ideal. However, if it is possible to lower the priority of required time, a risk-taking team has an advantage.
Team diversity
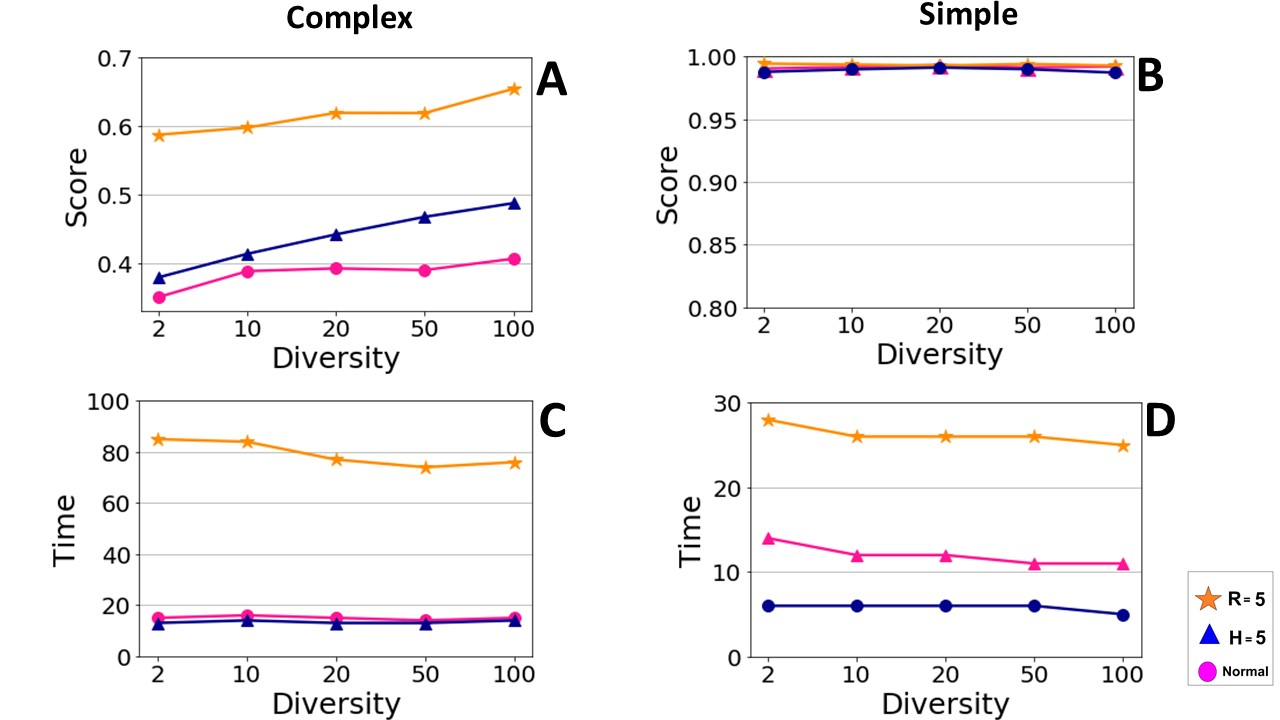
Increasing team size has a positive effect on team score (Figure 6). However, in this model, enlarging the team leads to an increase in the team’s background diversity. This is because each agent we add to the team initiates the simulation from a randomly-selected location in the landscape. To extract the effect of size from diversity, we kept team size constant while varying the level of diversity, D. The results demonstrate that independent of size, teams with greater diversity achieve higher scores (Figure 8 A). This is because agents spread to the wider portion of the landscape due to the higher initial diversity.
In the context of complex problems, although increasing the diversity improves teams’ scores, it does not have a substantial effect on the required time to find the final solution for teams that don’t take risks. (Figure 8 C). This is because agents of those teams climb their closest peak. Increasing the diversity leads those teams to climb more peaks in the landscape in a parallel way. Therefore, they have a higher chance to choose a higher peak to climb while it almost takes the same amount of time for them to climb the peak. Risk taking agents explore the landscape by taking large steps. More initial diversity increases the probability of having more steps in different directions. That helps the team to find its final solution in less time.
In the context of simple problems, all teams were able to reach the global maximum (Figure 8 B), however the more diverse teams were able to find the global maximum faster (Figure 8 D). There is only one peak in the landscape and a more diverse team has a higher probability of having agents in more elevated locations. That means they need less change to reach the global maximum. This is why higher diversity makes teams faster at converging to a globally optimal solution when they face simple problems.
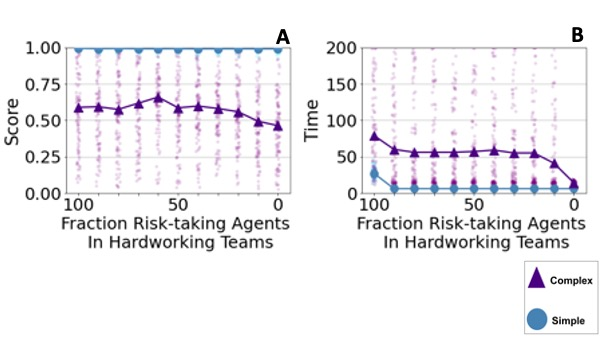
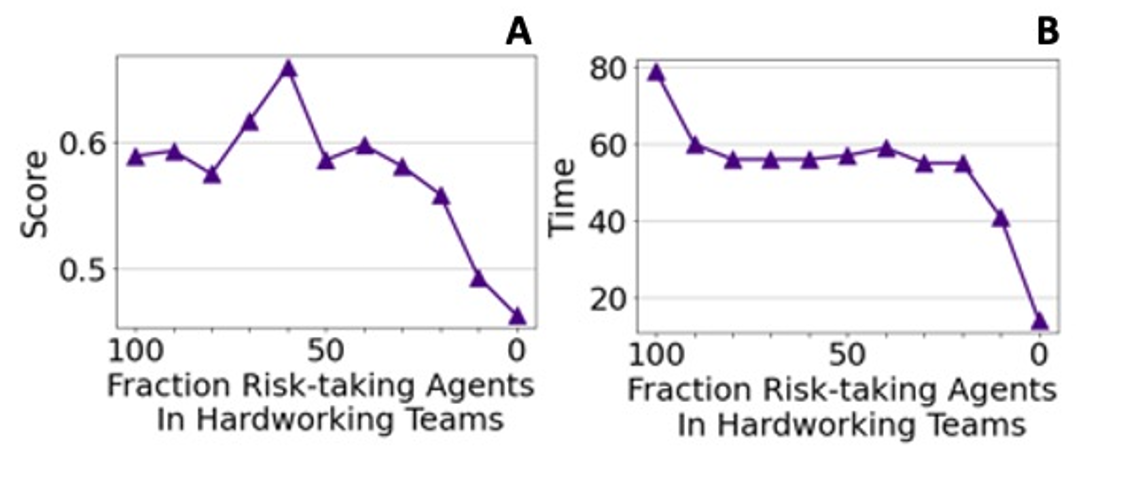
In order to compare the performance of diverse teams with non-diverse teams regarding search behavior diversity, we studied the performance of a team consisting only of risk-taking agents (\(R=5\)), a team that consisted only of hardworking agents (\(H=5\)), and teams that contained different ratios of both hardworking (\(H=5\)) and risk-taking agents (\(R=5\)). We indicated already that, when facing a complex problem, having more risk-taking agents in a team increases the final score (see Figure 4 B). The simulated result of diverse teams that contained both hardworking and risk-taking agents shows that a diverse team can reach a score which is even higher than that of the score of a team that contains only risk-taking agents (see Figure 9 A). This is because, in a corporation, risk-taking agents find elevated locations, and hardworking agents can find the adjacent peak of said elevated location.
The diverse team can reach a higher score without increasing the time it takes to reach the final solution (see Figure 9 B). Having a few hardworking team members (10 hardworking in a team of 100 in this instance) in a team with a majority of risk-taking agents can substantially decrease the required time for finding the final solution (see Figure 9 B both for complex and simple problems).
Discussion
This study has explored how several characteristics of teams affect their performance in collective problem-solving tasks. Team performance depends heavily on the problem complexity being dealt with. When facing simple problems, all teams usually reach the highest possible score. However, the factor that most substantially shapes teams’ superiority is the amount of time it takes them to reach their final output. For complex problems, however, both the quality of the final output and the time it takes for a team to reach that output matters. Boosting a hardworking culture or replacing team members with more hardworking ones can help a team reach an output by spending less time searching, regardless of the problem complexity. It also slightly improves the quality of the final result.
Boosting risk-taking culture in a team or replacing team members with those who are more willing to take risks is not recommended when a team has time limitations and is in a hurry. However, if a team is facing complex problems and is able to reduce time limitations, a moderate level of risk-taking can substantially improve the final output quality. Although both working hard and taking risks lead to improved final scores in the context of complex problems, the effect of taking risks was substantially larger than the effect of working hard. This is because risk-taking agents are better at escaping from local maxima. Teams of hybrid agents who express both hardworking and risk-taking behaviors can provide a high-quality output faster. They provide a better output because of their risk-taking behavior, and they reach their final output faster because of the hardworking traits of its members.
We also addressed two collective characteristics of teams: team size and diversity. Increasing the size of a team improves the output quality, although it might have a different effect on the time it takes for a team to reach the final solution, according to the dominant type or culture of a team. For a risk-taking team, a larger team require less time to find the final solution, while hardworking or normal teams require more time to reach the final output. We also compared teams with different levels of background diversity, and found that greater background diversity improved the output quality and decreased the time it takes for teams to find their final solution. It is important to recognize that we have assumed that the communication dynamic is exactly the same in both a diverse and non-diverse team, and assumption that may not always hold (Taras & Rowney 2007).
Having the search behavior diversity in a team with a proper ratio of hardworking and risk-taking team members, a team can reach to a score which have never been accessible by teams that only contain risk-taking or hardworking agents. In the future works the optimum ratio of hardworking and risk-taking agents in team with search behavior diversity should be studied. The optimum ratio might be related to the complexity of the problem that a team face. It also might be related to the connection degree of the agents ’communication network.
For situations in which a team of collective problem solvers faces complex problems, it could be advantageous to either encourage a moderate level of risk-taking culture or replace team members with those who would take more risks. This process would substantially improve the outcome quality; however, it would take longer for the team to reach the outcome. To speed up team progress, enlarging the team and recruiting team members with different and diverse backgrounds in addition to amplifying the hardworking culture (or recruiting hardworking members) would be solutions that have an impact on the problem-solving process.
When a team of collective problem solvers faces simple problems, taking risks may be disadvantageous, as risks both reduce the overall solution quality while increasing the time that required for the team to reach the final solution. If a team is capable of reaching the desired outcome, enlarging the team would not decrease the required time; however, amplifying the hardworking culture, replacing team members with more hardworking ones, and increasing the background diversity are among the factors that could help the team to reach the outcome more rapidly.
Our results suggest several general points that individuals assembling or managing problem-solving teams might take into account. First, consider the case where managers are confident that a problem is sufficiently simple that a team will eventually hit upon the best solution given enough time. In this case, their goal should be to minimize this search time. Our results indicate that a relatively small team of hard workers will outperform a larger team or a team dominated by risk-takers focused on outside-the-box solutions. In particular, teams where individuals have diverse backgrounds are likely to be especially effective.
Second, consider the case where the problem-solving team faces a complex problem, and the team manager is not confident that reaching the best possible solution is even possible. Here, the manager must weigh speed against solution quality. If the team is under time pressure and needs to find a good-enough solution in a very short time, assembling a small team members of hard workers is once again recommended. If time is less of a concern and the best possible solution is desired, incorporating risk-takers into the team is warranted. We find that a moderate level of risk taking can substantially improve the final result, although it requires more time for the team to reach a final solution. Enlarging a risk-taking team helps the team to reach the final solution in less time.
It is important to note that when a team is dealing with a complex problem, both hardworking and risk-taking strategies can improve the outcome quality of the team. However, the improvement that a risk-taking strategy can provide is substantially higher than the improvement cause by working harder, at the cost of increased time to a good-enough solution. Although taking risk is a time-consuming problem-solving strategy, it can substantially improve the output quality of a team. Adding a few hardworking team members to a team of risk-taking members can decrease the required time for solving the problem. Finally, increasing the diversity of background knowledge always improves team performance in terms of both speed and quality of solution.
We have focused on the independent effect of each behavioral characteristic and have only minimally considered the interactions and associations between those characteristics. For example, we have assumed that working hard has no association with other behaviors, such as getting tired or experiencing burnout. We have also assumed that the communication dynamic in this model disregards agent type, while in real life a characteristic of one team member might affect the way that they interact with other team members. The agents used in this model do not have a memory, and there are no agents that are “more experienced.” This means that working hard does not provide any benefits of experience. Future research might assess additional effects of risk taking and the hardworking characteristics, as well as their distribution in more complex organizational structures, such as hierarchies.
Acknowledgments
We thank Suzanne Sindi, Alexander Petersen, and Justin Yeakel for helpful discussion. Computational experiments were performed using the Multi-Environment Computer for Exploration and Discovery (MERCED) cluster at UC Merced, funded by National Science Foundation Grant ACI-1429783. Our model code extended NetLogo code written by Joshua Becker, whom we thank for making his code publicly available.Appendix
| Team Type | Size and Time Correlation Coefficient | Size and Score Correlation Coefficient |
| Normal | 0.98 (p1.99 e-6) | 0.91(p 0.0003) |
| \(H=5\) | 0.99 (p3.24 e-10) | 0.98 (p3.29 e-07) |
| \(R=6\) | -0.72 (p0.0183) | 0.81 (p0.004) |
The effect of different levels of hard work on team performance:
Comparing ordered model of social and individual learning with the reversed model:
In align with other similar models, in our model, agents first try social learning and if they could not any better solution, they try individual learning. This order (first social learning and then individual learning) is selected because in the real world the individual learning is costly, and it is easier to ask for a better solution from someone who already has it.
In the following plot we compared the outcome of reverse order (first individual learning and then social learning) with our model order of individual and social learning (first try social learning and then try individual learning). Although the outcome of both orders are not substantially different, the outcome of reverse order is superior in some of the cases. This is because in reverse order all agents explore the landscape in each run. Therefore, more of the landscape will be explored and finding a better solution is more likely. However, since this approach is highly costly and non-efficient in the real-world, we have not used it in our mode.
| Score/Team Size | Normal \(K10\) |
H5 \(K10\) |
R5 \(K10\) |
Normal \(K10\) |
H5 \(K10\) |
R5 \(K10\) |
|---|---|---|---|---|---|---|
| 10 | 0.26 | 0.29 | 0.42 | 0.93 | 0.93 | 0.93 |
| 20 | 0.26 | 0.30 | 0.48 | 0.96 | 0.95 | 0.96 |
| 30 | 0.26 | 0.34 | 0.53 | 0.97 | 0.96 | 0.97 |
| 40 | 0.32 | 0.34 | 0.58 | 0.98 | 0.97 | 0.98 |
| 50 | 0.38 | 0.40 | 0.58 | 0.98 | 0.97 | 0.98 |
| 60 | 0.35 | 0.39 | 0.59 | 0.98 | 0.98 | 0.98 |
| 70 | 0.37 | 0.41 | 0.61 | 0.99 | 0.98 | 0.99 |
| 80 | 0.36 | 0.44 | 0.62 | 0.99 | 0.98 | 0.99 |
| 90 | 0.39 | 0.46 | 0.62 | 0.99 | 0.98 | 0.99 |
| 100 | 0.40 | 0.49 | 0.63 | 0.99 | 0.99 | 0.99 |
| Score/Team Size | Normal \(K10\) |
H5 \(K10\) |
R5 \(K10\) |
Normal \(K10\) |
H5 \(K10\) |
R5 \(K10\) |
|---|---|---|---|---|---|---|
| 10 | 8 | 3 | 103 | 11 | 5 | 68 |
| 20 | 6 | 4 | 102 | 10 | 5 | 39 |
| 30 | 7 | 5 | 91 | 10 | 5 | 37 |
| 40 | 8 | 6 | 84 | 10 | 5 | 31 |
| 50 | 9 | 8 | 88 | 10 | 5 | 27 |
| 60 | 10 | 9 | 80 | 10 | 5 | 26 |
| 70 | 11 | 10 | 79 | 10 | 5 | 27 |
| 80 | 12 | 12 | 74 | 11 | 5 | 26 |
| 90 | 14 | 13 | 74 | 11 | 5 | 24 |
| 100 | 15 | 14 | 70 | 11 | 5 | 25 |
References
AMABILE, T. M., Conti, R., Coon, H., Lazenby, J., & Herron, M. (1996). Assessing the work environment for creativity. Academy of Management Journal, 39(5), 1154–1184. [doi:10.5465/256995]
APLIN, L. M., Farine, D. R., Mann, R. P., & Sheldon, B. C. (2014). Individual-level personality influences social foraging and collective behaviors in wild birds. Proceedings of the Royal Society B, 281(1789), 20141016. [doi:10.1098/rspb.2014.1016]
BARKOCZI, D., & Galesic, M. (2016). Social learning strategies modify the effect of network structure on group performance. Nature Communications, 7, 13109. [doi:10.1038/ncomms13109]
BAUMANN, O., Schmidt, J., & Stieglitz, N. (2019). Effective search in rugged performance landscapes: A review and outlook. Journal of Management, 45(1), 285–318. [doi:10.1177/0149206318808594]
BROWN, S. P., & Leigh, T. W. (1996). A new look at psychological climate and its relationship to job involvement, effort, and performance. The Journal of Applied Psychology, 81(4), 358–368. [doi:10.1037/0021-9010.81.4.358]
BROWNELL, E., Cagan, J., & Kotovsky, K. (2020). Only as strong as the strongest link: The impact of individual team member proficiency in configuration design. ASME 2020 International Design Engineering Technical Conferences and Computers and Information in Engineering Conference. [doi:10.1115/detc2020-22152]
CHAO, R. O., & K., S. (2008). A theoretical framework for managing the new product development portfolio: When and how to use strategic buckets. Management Science, 54(5), 907–921. [doi:10.1287/mnsc.1070.0828]
CSASZAR, F. A. (2018). A note on how NK landscapes work. Journal of Organization Design, 7(1), 1–6. [doi:10.1186/s41469-018-0039-0]
DIETZ, T., Scott Frey, S., & Rosa, E. A. (1996). 'Risk, technology, and society.' In R. E. Dunlap & W. Michelson (Eds.), Handbook of Environmental Sociology. Westport, CT: Greenwood Press.
EHN, M., & Laland, K. (2012). Adaptive strategies for cumulative cultural learning. Journal of Theoretical Biology, 301, 103–111. [doi:10.1016/j.jtbi.2012.02.004]
ELÇI, M., Sener, I., & Alpkan, L. (2011). The impact of morality and religiosity of employees on their hardworking behavior. Procedia - Social and Behavioral Sciences, 24, 1367–1377.
FANG, C., Lee, J., & Schilling, M. A. (2010). Balancing exploration and exploitation through structural design: The isolation of subgroups and organizational learning. Organization Science, 21(3), 625–642. [doi:10.1287/orsc.1090.0468]
FOLEY, M., & Riedl, C. (2015). Collective problem-Solving by heterogeneous agents in network environments. Available at: https://sites.lsa.umich.edu/wp-content/uploads/sites/176/2015/02/Foley-and-Riedl-CI-2015-Abstract.pdf.
FONTANARI, J. F. (2016). When more of the same is better. EPL (Europhysics Letters), 113(2), 28009. [doi:10.1209/0295-5075/113/28009]
FREY, R., Pedroni, A., Mata, R., Rieskamp, J., & Hertwig, R. (2017). Risk preference shares the psychometric structure of major psychological traits. Science Advances, 3(10), e1701381. [doi:10.1126/sciadv.1701381]
GEORGE, A. J., & Gray, I., I. (2000). Jumping or walking: Which is better? Immunology Today, 21(1), 55. [doi:10.1016/s0167-5699(99)01567-4]
GOMEZ, C. J., & Lazer, D. M. J. (2019). Clustering knowledge and dispersing abilities enhances collective problem solving in a network. Nature Communications, 10(1), 5146. [doi:10.1038/s41467-019-12650-3]
GOWERS, T., & Nielsen, M. (2009). Massively collaborative mathematics. Nature, 461(7266), 879–881. [doi:10.1038/461879a]
HAGEMANN, V., & Kluge, A. (2017). Complex problem solving in teams: The impact of collective orientation on team process demands. Frontiers in Psychology, 8, 1730. [doi:10.3389/fpsyg.2017.01730]
HOLMES, T. L., & S., R. (2002). Effects of job perceptions on job behaviors: Implications for sales performance. Industrial Marketing Management, 31(5), 421–428. [doi:10.1016/s0019-8501(01)00158-4]
HONG, L., & Page, S. E. (2004). Groups of diverse problem solvers can outperform groups of high-ability problem solvers. Proceedings of the National Academy of Sciences, 101(46), 16385–16389. [doi:10.1073/pnas.0403723101]
HORWITZ, S. K., & HORWITZ, I. B. (2007). The effects of team diversity on team outcomes: A meta-Analytic review of team demography. Journal of Management, 33(6), 987–1015. [doi:10.1177/0149206307308587]
KAUFFMAN, S. A., & Johnsen, S. (1991). Coevolution to the edge of chaos: Coupled fitness landscapes, poised states, and coevolutionary avalanches. Journal of Theoretical Biology, 149(4), 467–505. [doi:10.1016/s0022-5193(05)80094-3]
KAUFFMAN, S. A., & Weinberger, E. D. (1989). The NK model of rugged fitness landscapes and its application to maturation of the immune response. Journal of Theoretical Biology, 141(2), 211–245. [doi:10.1016/s0022-5193(89)80019-0]
KHRAISHA, T. (2020). Complex economic problems and fitness landscapes: Assessment and methodological perspectives. Structural Change and Economic Dynamics, 52, 390–407. [doi:10.1016/j.strueco.2019.01.002]
LAZER, D., & Friedman, A. (2007). The network structure of exploration and exploitation. Administrative Science Quarterly, 52(4), 667–694. [doi:10.2189/asqu.52.4.667]
LEVINTHAL, D. A. (1997). Adaptation on rugged landscapes. Management Science, 43(7), 934–950. [doi:10.1287/mnsc.43.7.934]
LEVINTHAL, D., & March, J. G. (1981). A model of adaptive organizational search. Journal of Economic Behavior & Organization, 2(4), 307–333. [doi:10.1016/0167-2681(81)90012-3]
LORENZ, J., Rauhut, H., Schweitzer, F., & Helbing, D. (2011). How social influence can undermine the wisdom of crowd effect. Proceedings of the National Academy of Sciences, 108(22), 9020–9025. [doi:10.1073/pnas.1008636108]
LORENZ, J., Rauhut, H., Schweitzer, F., Helbing, K., D.Mehlhorn, Newell, B. R., Todd, P. M., Lee, M. D., Morgan, K., Braithwaite, V. A., Hausmann, D., Fiedler, K., & Gonzalez, C. (2015). Unpacking the exploration-exploitation tradeoff: A synthesis of human and animal literatures. Decisions, 2(3), 191. [doi:10.1037/dec0000033]
MILLER, M. J., Woehr, D. J., & Hudspeth, N. (2002). The meaning and measurement of work ethic: Construction and initial validation of a multidimensional inventory. Journal of Vocational Behavior, 60(3), 451–489. [doi:10.1006/jvbe.2001.1838]
NIGG, J. T. (2017). Annual research review: On the relations among self-regulation, self-control, executive functioning, effortful control, cognitive control, impulsivity, risk-taking, and inhibition for developmental psychopathology. Journal of Child Psychology and Psychiatry and Allied Disciplines, 58(4), 361–383. [doi:10.1111/jcpp.12675]
PAGE, S. E. (2008). The Difference: How the Power of Diversity Creates Better Groups, Firms, Schools, and Societies. Princeton, NJ: Princeton University Press.
PAGE, S. E. (2019). The Diversity Bonus: How Great Teams Pay Off in the Knowledge Economy. Princeton, NJ: Princeton University Press. [doi:10.2307/j.ctvc77fcq]
PESSIMA, J. D., & Dietz, B. (2019). 'Global talent management.' In V. Hammler Kenon & S. V. Palsole (Eds.), The Wiley Handbook of Global Workplace Learning (pp. 155–170). Hoboken, NJ: Wiley. [doi:10.1002/9781119227793.ch9]
RENN, O. (1998). Three decades of risk research: Accomplishments and new challenges. Journal of Risk Research, 1(1), 49–71. [doi:10.1080/136698798377321]
RICHARD Hackman, J. (2002). Leading Teams: Setting the Stage for Great Performances. Cambridge, MA: Harvard Business Review Press.
RIVKIN, J. W. (2000). Imitation of complex strategies. Management Science, 46(6), 824–844. [doi:10.1287/mnsc.46.6.824.11940]
SANTOS, F. C., Pinheiro, F. L., Lenaerts, T., & Pacheco, J. M. (2012). The role of diversity in the evolution of cooperation. Journal of Theoretical Biology, 299, 88–96. [doi:10.1016/j.jtbi.2011.09.003]
SCHANK, J. C., & Wimsatt, W. C. (2012). Generative entrenchment and evolution. PSA: Proceedings of the Biennial Meeting of the Philosophy of Science Association, 1986(2), 33–60. [doi:10.1086/psaprocbienmeetp.1986.2.192789]
SHORE, J., Bernstein, E., & Lazer, D. (2015). Facts and figuring: An experimental investigation of network structure and performance in information and solution spaces. Organization, 26(5), 1432–1446. [doi:10.1287/orsc.2015.0980]
SHUGARS, S. (2020). Good decisions or bad outcomes? A model for group deliberation on value-Laden topics. Communication Methods and Measures, 1–19. [doi:10.1080/19312458.2020.1768521]
SIGGELKOW, N., & Levinthal, D. A. (2003). Temporarily divide to conquer: Centralized, decentralized, and reintegrated organizational approaches to exploration and adaptation. Organization Science, 14(6), 650–669. [doi:10.1287/orsc.14.6.650.24840]
SMITH, E. B., & Hou, Y. (2015). Redundant heterogeneity and group performance. Organization Science, 26(1), 37–51. [doi:10.1287/orsc.2014.0932]
SOCIETY for Human Resource Management (SHRM). (2016). 2016 Human Capital Benchmarking Report. Available at: https://www.shrm.org/hr-today/trends-and-forecasting/research-and-surveys/documents/2016-human-capital-report.pdf.
SUH, T. (2002). Encouraged, motivated and learning oriented for working creatively and successfully: A case of Korean workers in marketing communications. Journal of Marketing Communications, 8(3), 135–147. [doi:10.1080/13527260210147315]
SUH, T., & Shin, H. (2008). When working hard pays off: Testing creativity hypotheses. Corporate Communications: An International Journal, 13(4), 407–417. [doi:10.1108/13563280810914838]
TANSLEY, C., Harris, L., Stewart, K., Turner, P., Foster, C., & Williams, H. (2006). Talent Management: Understanding the Dimensions Change Agenda. London: CIPD.
TARAS, V., & Rowney, J. (2007). Effects of cultural diversity on in-class communication and student project team dynamics: Creating synergy in the diverse classroom. International Studies in Educational Administration (Commonwealth Council for Educational Administration & Management (CCEAM)), 35(2).
TREMBLAY, D. G. (2002). 'Patterns, trends, and the policy implications of earnings inequality and unemployment.' In G. Wong & G. Picot (Eds.), Working Time in Comparative Perspective. Kalamazoo, MI: WE Upjohn Institute for Employment Research. [doi:10.7202/006914ar]
WANG, Y., & P., P. (2010). Entrepreneurial risk taking: Empirical evidence from UK family firms. International Journal of Entrepreneurial Behavior & Research, 16(5), 370–388. [doi:10.1108/13552551011071841]
WESTHOFF, F. H., Yarbrough, B. V., & Yarbrough, R. M. (1996). Complexity, organization, and Stuart Kauffman’s The Origins of Order. Journal of Economic Behavior & Organization, 29(1), 1–25. [doi:10.1016/0167-2681(95)00049-6]
WOOLLEY, A. W., Chabris, C. F., Pentland, A., Hashmi, N., & Malone, T. W. (2010). Evidence for a collective intelligence factor in the performance of human groups. Science, 330(6004), 686–688. [doi:10.1126/science.1193147]
WUCHTY, S., Jones, B. F., & Uzzi, B. (2007). The increasing dominance of teams in production of knowledge. Science, 316(5827), 1036–1039. [doi:10.1126/science.1136099]
YAHOSSEINI, K. S., & Moussaïd, M. (2019). Search as a simple take-the-best heuristic. Royal Society Open Science, 6(10), 190529. [doi:10.1098/rsos.190529]
YAHOSSEINI, K. S., & Moussaïd, M. (2020). Comparing groups of independent solvers and transmission chains as methods for collective problem-Solving. Scientific Reports, 10(1), 3060. [doi:10.1038/s41598-020-59946-9]