An Empirical and Simulation Investigation of Bounded Confidence and Negative Influence in Opinion Dynamics Using Stochastic Actor-Oriented Modelling

,
and
aInformatics Institute, University of Amsterdam, The Netherlands; bDepartment of Sociology, University of Groningen, The Netherlands; cNuffield College, University of Oxford, United Kingdom
Journal of Artificial
Societies and Social Simulation 28 (1) 2
<https://www.jasss.org/28/1/2.html>
DOI: 10.18564/jasss.5566
Received: 04-Mar-2024 Accepted: 20-Dec-2024 Published: 31-Jan-2025
Abstract
Bounded confidence and negative influence are two of the most important micro-level mechanisms employed in computational models of opinion dynamics to explain polarization of opinions. However, empirical evidence of both mechanisms is debatable. Two common limitations in existing empirical studies are (1) the limited external validity of laboratory experiments, and (2) the inability in study designs to disentangle negative influence from bounded confidence, as well as from other social influence mechanisms like assimilation. We address both limitations, using the Stochastic Actor-Oriented Model (SAOM) with a longitudinal field data set that tracks adolescents’ social network relations and opinions on a set of issues. Two new SAOM effects are introduced to represent bounded confidence and negative influence, respectively. Results show that for adolescents’ preferences on rap/ hip hop clothing style, the model containing both effects, in addition to assimilative influence from friends, provides a good fit to the data, but only the effects representing negative influence and assimilative influence from friends are statistically significant. The results support that negative influence contributes to explaining observed opinion changes, but lend little weight to bounded confidence. Further simulation studies based on the empirically estimated model show that our model implies only low levels of opinion polarization at the macro-level despite negative influence at the micro-level. We conclude that our approach not only overcomes common limitations of earlier empirical work, but also bridges the SAOM and agent-based modeling by offering empirically validated insights into opinion dynamics.Introduction
If inequality is the playground for economists, then undoubtedly polarization has been the amusement park for computational modelers of societal opinion dynamics in recent decades. As an ongoing threat to the society, polarization, the tendency of a group to fall apart into opposing camps with increasing disagreement, remains one of the most debated and elusive topics in the field, especially when it comes to its underlying mechanisms. Classic opinion dynamics models were built on the key assumption of assimilation (or positive influence)1, which reduces opinion differences between interacting individuals. In connected networks, assimilation taking place between neighbors almost2 inevitably leads to consensus, the opposite of polarization (Berger 1981; DeGroot 1974; French Jr. 1956). The causality between assimilation and consensus leads scholars to wonder, “if people tend to become more alike in their beliefs, attitudes, and behavior when they interact, why do not all such differences eventually disappear?” (Axelrod 1997 p. 203).
In search of explanations for polarization, two of the most prominently proposed micro-level mechanisms that researchers have combined with the assimilative influence of classic opinion dynamics models, are bounded confidence (Deffuant et al. 2000; Hegselmann & Krause 2002; Krause 2000) and negative (or, repulsive; see Flache et al. 2017) influence (Jager & Amblard 2005; Macy et al. 2003). The bounded confidence mechanism assumes that people are only (assimilatively) influenced by others with sufficiently similar opinions, while negative influence refers to the distancing from the opinions of discrepant others. In the most basic models, the conditions to activate these two mechanisms are based on the opinion difference between individuals prior to an interaction, and the outcomes in both models are changes in opinion difference. For bounded confidence, the prior difference must be sufficiently small, in which case this opinion difference is further reduced through the interaction. For negative influence, the activation condition is that the individuals have sufficiently different prior opinions, and the outcome is that individuals shift their opinions away from that of the source of influence, further amplifying the disagreement3. Large strands of literature include only bounded confidence (e.g., Deffuant et al. 2000, 2002; Hegselmann & Krause 2002), while some implementations (e.g., Jager & Amblard 2005) combined both bounded confidence and negative influence, based on social judgment theory, assuming that people experience assimilative influence from those with a low level of disagreement, and no influence from others with an intermediate level of disagreement (bounded confidence), while being repulsed by even more distant opinions (negative influence). Others do not allow for a “neutral zone” in which the focal agent is not influenced at all by a particular other agent, and can thus be considered as a “gap-free” combination of bounded confidence and negative influence (e.g., Flache & Macy 2011; Axelrod et al. 2021). It is fair to conclude that bounded confidence and negative influence represent two self-reinforcing dynamics which both can produce persistent disagreement despite assimilative social influence, by making only sufficiently similar individuals more similar to each other (bounded confidence), and by making sufficiently dissimilar individuals more dissimilar (negative influence). By acknowledging this, a number of opinion dynamics models using either one or both of these two mechanisms have been proposed and a range of studies have demonstrated how these models generate non-consensus opinion distributions, including polarization, under certain conditions (e.g., Deffuant et al. 2000, 2002; Axelrod et al. 2021; Flache & Macy 2011; Hegselmann & Krause 2002; Jager & Amblard 2005). Bounded confidence and negative influence therefore take center stage in not only polarization studies but also the field of opinion dynamics.
Although the assumptions of the two mechanisms seem to be intuitive, it is actually difficult to find solid empirical evidence to support them. On one hand, mixed evidence, especially for negative influence, has been found in the literature; on the other hand, existing empirical studies usually suffer from two common limitations: the limited external validity of laboratory experiment settings, and the lack of ability to disentangle negative influence from bounded confidence, and disentangle these two mechanisms from other micro-level mechanisms in opinion dynamics (Mäs & Flache 2013; Takács et al. 2016). To summarize, despite their important roles in explaining polarization, it remains unclear whether bounded confidence and negative influence are empirically supported.
One of the major obstacles to identifying the role of bounded confidence and negative influence in field settings is the co-occurrence of other – similar, but distinct – micro-level mechanisms of social influence. Importantly, for many empirical contexts, such as in peer influence among adolescents, a competing theory is that influence processes play not uniformly between all members in a group, but in the first place between friends. This is a common paradigm in developmental psychology (Brechwald & Prinstein 2011; Laursen & Veenstra 2021; van Zalk et al. 2013) and more widely in social group research (Wölfer & Hewstone 2017). For social influence with respect to out-group opinions, it is important to distinguish between the numbers of in-group and out-group friends, and their opinions (Bracegirdle et al. 2022; Zingora et al. 2020). Because of homophily (i.e., friendship choice based on similarity, McPherson et al. 2001), opinions of friends will tend to be more similar to those of the focal individual. This may lead to some overlap in the explanation of social influence by bounded confidence and by the assimilative influence from friends.
This paper investigates bounded confidence and negative influence in the dynamics of Dutch adolescents’ opinions of rap/ hip hop clothing style in a secondary school class context. By using longitudinal network data from The Arnhem School Study (TASS) (Stark 2011; Stark & Flache 2012) collected in a field setting, the external validity of this empirical test is assured. In the meantime, recent developments in Stochastic Actor-Oriented Models (SAOM) (Snijders 2017; Steglich et al. 2010) allow disentangling these two mechanisms from each other and from other mechanisms, making it possible to empirically assess the evidence of them respectively, while controlling for other factors such as assimilative influence from friends, and the change of networks that may happen in tandem with the change in opinions. For this purpose, we have developed two new SAOM effects4 to represent bounded confidence and negative influence in the SAOM framework, namely \(\epsilon\)-near similarity and \(\kappa\)-far similarity. The two effects capture the influence of others (irrespective of friendship ties) whose opinions are sufficiently similar or dissimilar, respectively, to the opinion of the focal agent given a threshold \(\epsilon\) or \(\kappa\).
Results show that for the preferences of rap/ hip hop clothing style (ranging from \(1\) – dislike, to \(5\) – like), a model including both 1-near similarity, representing the influence from all those whose opinion difference with the focal adolescent is no larger than \(1\), and 3-far similarity, representing the influence from all those whose opinion difference with the focal adolescent is at least \(3\), as well as including assimilative influence from friends, provides a good fit to the data. Further, our simulation studies based on this model show that it gives a good representation of the development over time of the shape of the empirically observed opinion distribution. However, 1-near similarity is statistically insignificant, showing little support for bounded confidence by our data, while the parameter estimate for 3-far similarity is significantly negative, implying the tendency to distance oneself from dissimilar others, and hence serves as the evidence of negative influence. The results are valid regardless of the inclusion of friends’ influence in the model. At the same time, our simulations also show that the interplay of multiple simultaneous mechanisms identified in the data with negative influence does not yield a clear tendency towards opinion polarization in classes.
In Section 2, we will further discuss the two mechanisms and relevant empirical and simulation research forming the background of our study. Section 3 will introduce information about the methods, data, and model specification. Results will be presented in Section 4, followed by the conclusions and discussions in Section 5.
Backgrounds
In what follows, we discuss theoretical foundations, mathematical implementations, and typical macro behaviors of opinion dynamics models of bounded confidence or negative influence. Further, earlier empirical studies aiming to test these mechanisms will be discussed. An extensive coverage of these literatures would lead beyond the scope of this paper, and we refer the interested reader to recent contributions on bounded confidence (Hegselmann 2023) and negative influence (Liu et al. 2022), as well as a recent overview of the field (Flache et al. 2017).
Bounded confidence
Introduced to the community of opinion dynamics more than twenty years ago (Deffuant et al. 2000; Dittmer 2001; Hegselmann & Krause 2002; Krause 2000), the mechanism of bounded confidence provides a surprisingly simple way to generate non-consensus opinion distributions by ruling out interactions between dissimilar agents. Formally, in a system containing \(N\) agents, consider two arbitrary agents \(i\) and \(j\) (\(1\leq i, j \leq N\)), each having a continuous opinion \(o_i\) and \(o_j\), respectively. Agent \(i\) will interact with, and hence is influenced by, agent \(j\) if and only if \(|o_i-o_j|<\epsilon\), where \(\epsilon\) is a given threshold. Otherwise, the opinion of \(i\) will not be influenced by the opinion of \(j\). The threshold \(\epsilon\) is called confidence level (Hegselmann & Krause 2002), which can be interpreted as the agent’s “uncertainty, or bounded confidence, around the opinion” (Deffuant et al. 2002). In the literature, \(\epsilon\) is usually set to be constant.
There are different ways to implement bounded confidence. The Deffuant Model and the Hegselmann-Krause Model are probably the best-known ones. In the Deffuant Model (Deffuant et al. 2000), in every time step of the dynamic, two agents \(i\) and \(j\) from the population are randomly chosen for an interaction. If \(|o_i-o_j|<\epsilon\), both agents update their opinions to move towards the opinion of the other according to the following equations:
| \[ \begin{aligned} o_i(t+1)= o_i(t) + \mu(o_i(t)-o_j(t))\\ o_j(t+1)= o_j(t) + \mu(o_j(t)-o_i(t)) \end{aligned}\] | \[(1)\] |
In the Hegselmann-Krause Model (Hegselmann & Krause 2002), agent \(i\) will take into account all the other “qualified” agents in the system at the same time:
| \[ \begin{aligned} o_i(t+1)=\frac{\sum_{j\in B(i, \epsilon)}o_j(t)}{|B(i, \epsilon)|}\\ B(i,\epsilon)=\{j|\hspace{0.2cm}|o_i-o_j|\leq \epsilon\} \end{aligned}\] | \[(2)\] |
It is not difficult to find out from Equations (1) and (2) that the opinion difference between the interacting agents (given agent \(i\) as the focal agent, this refers to \(|o_i-o_j|\) in the Deffuant Model and \(|o_i-\sum_{j\in B(i, \epsilon)}o_j/|B(i,\epsilon)||\) in the Hegselmann-Krause Model) is reduced from \(t\) to \(t+1\) in both models. In fact, the influence between similar agents under bounded confidence, although not being formally required, is usually (and almost by default) assumed to be assimilative5, meaning that the opinions of the agents will become more similar afterwards.
The two models exhibit similar features. For example, under the condition of a sufficiently small \(\epsilon\) and a uniform initial distribution of opinions, they end up in the non-consensus outcome of opinion clustering, the intermediate state between consensus and polarization (Castellano et al. 2009).
Importantly for our study, bounded confidence can provide an explanation for the emergence of a fairly polarized opinion distribution if individuals with extreme opinions have a narrow confidence level, largely insulating them from outside influences, while they are still influencing other, initially more moderate agents (Deffuant et al. 2002). To summarize, bounded confidence is considered an important step towards explaining polarization.
In terms of behavioral theory, bounded confidence does have its roots in the theory of confirmation bias, which refers to “unwitting selectivity in the acquisition and use of evidence” (Nickerson 1998 p. 175). In the context of opinion dynamics, this means agents are open to the opinions of others that are in line with or confirm their own opinions, and ignore the opinions of others that contradict or undermine their own opinions. Bounded confidence is also closely related to social judgment theory (Sherif et al. 1965; Sherif & Hovland 1961). Social judgment theory links an individual’s opinion change (also referred to as “attitude change” in the context of social judgment theory) with his/her judgment of the opinion difference between the received opinion of others and his/her own opinion. In particular, social judgment theory divides for each individual (i.e., the recipient of an opinion) the opinion spectrum for received opinions into three regions: (1) the latitude of acceptance, containing opinions the recipient finds sufficiently close for being acceptable, (2) the latitude of non-commitment, containing more distant opinions to which the recipient is indifferent or he/she does not evaluate, and (3) the latitude of rejection, containing opinions the recipient finds objectionable (Sherif et al. 1973; Sherif 1960). While the rejection of outside opinions in the social judgment model can be interpreted such that the focal actor is not influenced by a rejected opinion (bounded confidence), some studies (e.g., Jager & Amblard 2005) also assume that opinions falling into the latitude of rejection impose repulsive influence on the recipient, combining the assumptions of a “pure” bounded confidence model with those of a “pure” model of negative influence. Bounded confidence models, combined with negative influence or not, can be seen as a computational implementation of social judgment theory, abstracting from a number of further psychological complications, e.g., distorted perception of the opinion position of a source (Sarup et al. 1991). The opinion change mechanism described by social judgment theory will be identical to the bounded confidence mechanism if (1) the recipient’s judged position is the real position of the received opinion, and (2) the judged position falling into the latitude of acceptance will lead to positive influence/ assimilation, and otherwise there will be no influence of any kind from the opinion of the source of influence and (3) for models of “pure” bounded confidence, both opinions falling into the latitude of non-commitment and into the latitude of rejection have no influence on the recipient.
Negative influence
Notwithstanding the ability of bounded confidence to give rise to non-consensus distributions under specific conditions, researchers also explored alternative micro-processes. One limitation of bounded confidence models that motivated this exploration is that opinion clustering can be easily undermined by small random distortions of opinion changes (Mäs 2010). Further, bounded confidence typically requires the presence of individuals with extreme opinions from the outset for generating polarization, whereas researchers became interested in the possibility that opinions of a population may become over time even more extreme and opinion divisions grow larger than they were in the initial situation. Thus, in the past decades, another mechanism – negative influence – has gained scholarly attention in the field. Negative influence, also known as rejection (Flache & Macy 2006; Flache & Mäs 2008; Huet et al. 2008; Mäs & Bischofberger 2015), distancing (Mark 2003; Mäs & Flache 2013), differentiation (Axelrod et al. 2021; Flache & Macy 2011), repulsion (Cornacchia et al. 2020; Flache et al. 2017; Macy et al. 2003; Radillo-Dı́az et al. 2009), contrast (Jager & Amblard 2005), boomerang effect (Hovland et al. 1957; Hovland & Pritzker 1957), or backfire effect (Bail et al. 2018; Nyhan & Reifler 2010) in the literature, refers broadly to the phenomenon that an individual changes his/her opinion to become more dissimilar to that of his/her source of influence, which is often another individual (Mäs & Flache 2013; Takács et al. 2016). Negative influence may also be triggered by different group memberships or one’s desire to be unique (Bourdieu 1984; Feliciani et al. 2017; Mark 2003), but in the literature of opinion dynamics, negative influence is usually assumed to be triggered by sufficiently dissimilar opinions (Axelrod et al. 2021; Flache & Macy 2011; Huet et al. 2008; Jager & Amblard 2005; Turner & Smaldino 2018). Hereafter the minimum opinion discrepancy that induces negative influence is referred to as the threshold of negative influence. Flache & Macy (2011) used the notion of “endogenous weights” to represent the relations between agents. For a pair of connected (by social networks) agents \(i\) and \(j\) whose opinions are within the range of \([-1, 1]\), the weight is calculated as follows:
| \[ w_{i,j}(t+1)=1-|o_j(t)-o_i(t)|\] | \[(3)\] |
| \[ \Delta o_i(t) = \frac{1}{2}w_{ij}(t)(o_j(t)-o_i(t))\] | \[(4)\] |
| \[ o_i(t+1)= \begin{cases} & o_i(t)+\Delta o_i(t)(1 - \Delta o_i(t)) \hspace{0.5cm} \text{if } \Delta o_i(t)\geq 0\\ & o_i(t)+\Delta o_i(t)(1 + \Delta o_i(t)) \hspace{0.5cm} \text{otherwise}\\ \end{cases}\] | \[(5)\] |
From Equations (4) and (5), one can tell that a negative weight will lead \(o_i\) to be more distant to \(o_j\) at \(t+1\) than at \(t\), implying a negative influence from agent \(j\) to agent \(i\). To summarize, the negative influence mechanism will amplify the sufficiently large discrepancy between agents’ opinions at the individual level.
Negative influence is usually implemented together with assimilative influence or bounded confidence (e.g., Jager & Amblard 2005; Flache & Macy 2011). Technically, models containing only assimilative and negative influence can be seen as a special case of models combining bounded confidence and negative influence. In such models, for a given opinion discrepancy, at most one of the two mechanisms is assumed to prevail. In some implementations, the bounded confidence threshold can be smaller than the negative influence threshold, so that there is no influence from a source when the discrepancy lies between the two thresholds (e.g., Jager & Amblard 2005).
One reason negative influence typically is combined with assimilative influence or bounded confidence is that there is overwhelming empirical support for assimilative influence being an important mechanism in social influence processes. For another reason, the co-occurrence of assimilative and negative influence typically is a key element in how these models generate increasing opinion polarization.
The models containing both mechanisms (whether assimilative influence + negative influence or bounded confidence + negative influence) are known for their abilities to generate opinion polarization (Axelrod et al. 2021; Flache & Macy 2011; Huet et al. 2008; Jager & Amblard 2005; Turner & Smaldino 2018). The rationale is that the combination of bounded confidence and negative influence leads to a self-reinforcing process that makes similar agents more similar and dissimilar agents more dissimilar. If this happens, agents with moderate opinions will be attracted (via assimilative influence or bounded confidence) by those who are pushed (via negative influence) to one of the extreme ends of the opinion spectrum, and eventually everyone will have an extreme opinion. Given appropriate conditions, polarization will emerge.
The “symbiosis” of bounded confidence and negative influence can be further justified by their shared theoretical foundations. As summarized by Flache et al. (2017), many opinion dynamics models (Baldassarri & Bearman 2007; Huet et al. 2008; Jager & Amblard 2005; Macy et al. 2003) based the assumption of negative influence on the same theories on which the assumption of bounded confidence was based, including social judgment theory (Sherif & Hovland 1961), cognitive dissonance theory (Festinger 1957), and balance theory (Heider 1946), from a different perspective. For example, in social judgment theory, if the judged position of the received opinion falls in the recipient’s latitude of rejection (which is the most distant latitude from the recipient’s own position), the recipient may shift his/her opinion farther away from the judged position (Eagly & Telaak 1972).
Empirical studies
Although both bounded confidence and negative influence seem to be well vindicated by a variety of theories in sociology and psychology, there is an ongoing quest for solid empirical evidence supporting these micro-processes due to the following challenges: (1) a substantial portion of empirical studies failed to find evidence of bounded confidence or negative influence, and (2) the empirical studies share some limitations. In what follows, we discuss existing experimental studies and field studies.
Laboratory experiments
Whereas experimental studies specifically aiming to test the bounded confidence assumptions are relatively rare, there are several laboratory experiment studies focusing on the role of the discrepancy between a recipient’s own opinion and the advocated opinion in opinion changes of the recipient. The common research practice is that the participants are exposed to messages of different opinions on a given topic; the participants’ own opinions are measured before and after the exposure. Together with some more recent studies, they have provided a large body of evidence as well as counter-evidence of not only bounded confidence but also negative influence. Some of these studies, to various extents, lend support to bounded confidence (Eagly & Telaak 1972; Hovland et al. 1957; Whittaker 1963). On the contrary, some experiments of similar designs did not find evidence of bounded confidence or negative influence, and may even exclusively support the simplest social influence assumption: assimilation (Aronson et al. 1963; Freedman 1964; Goldberg 1954; Hovland & Pritzker 1957; Takács et al. 2016; Zimbardo 1960).
Regardless of the mixed findings, the following shared limitations make the evidence or counter-evidence from laboratory experiments less powerful. In most laboratory experiments participants were exposed to the manipulated messages a limited number of times (usually once), and the post-treatment opinions were measured right after the exposure and/or after some other questions were answered while the participants were still on-site. In these cases, the infrequent stimulus might have limited effects, participants might not have enough time or chances to form new opinions, or they still might remember clearly their previous answers (pre-treatment opinions) and want to strive for consistency (“consistency effect”; see van Knippenberg & Wilke 1988). In some experiments, the opinions were also measured days after the exposure (e.g., Mackie 1986). While this strategy did help extend the time span, the participants’ opinions might be affected by external factors that we were not aware of. The issue of low stimulus frequency and short time span is more apparent if the participants care about the topic a lot as they should have already been exposed to various arguments and have formed relatively stable pre-treatment opinions. As Sherif & Sherif (1967) predicted: “the more the person is involved in this issue (the more important it is to him), the less susceptible he will be to short-term attempts to change his attitude” (p. 133). Besides, participants’ self-reported opinions may be inconsistent with the changes in their real opinions due to normative social influence (Deutsch & Gerard 1955), especially when group identities are involved. This means that they may report opinions to match group norms or to please others (such as the experimenter). Even if the reported opinion changes are true, such changes may be temporary and limited to the laboratory environment. These issues fall under the umbrella of the general concern about the external validity of laboratory experiments on social influence assumptions: how much trust shall we have in what has been observed in the laboratory when placed in a complex social system? To be sure, more recent studies aim to further address the limited external validity of experiments by means such as recruiting participants from real-world ideological online groups and then exposing participants to messages signaling the ideological commitment of the source. With such a design, Keijzer et al. (2024) found some support for negative influence from strongly discrepant sources. Nevertheless, such a design still does not allow to disentangle relational dynamics between individuals from social influence processes, leaving open the question that to what extent evidence of negative influence is robust against including network dynamics.
Field studies
Apart from laboratory experiments, Bail et al. (2018) and Kozitsin (2023) did field experiments on social media. In Bail et al. (2018)‘s experiment, Republican participants became significantly more conservative after exposed to liberal bots, while Democratic participants became more liberal to a smaller and statistically insignificant extent after exposure to conservative bots. This experiment includes sufficient frequency of stimulus and longevity of time span, but there are also limitations. First, participants of the experiment were exclusively self-identified Republicans/ Democrats who were active Twitter users. Therefore, as the authors themselves also noted, the results cannot be generalized to the whole population. In addition, around \(40\%\) invited participants rejected to follow the bot, which further intensified the sampling bias. Second, since the messages retweeted by the bot were from political accounts (including well-known politicians), it is unclear whether the negative influence was caused by the opinion discrepancy with the message or by the participants’ negative feelings about the political account being retweeted. It is also unclear whether the opinion changes of the participants were results of pure negative influence or of both bounded confidence and negative influence, since participants may have large thresholds or latitudes of acceptance that enable the influence from the bots to fall into the category of bounded confidence. This may explain the asymmetric responses of Republicans and Democrats if Democrats, in general, have larger thresholds.
Kozitsin (2023) analyzed the data from VKontakte of users’ opinions and friendship networks across 2018. The study confirmed that small (large) opinion discrepancies between users and their friends would most likely reduce (increase) the discrepancies. In other words, both bounded confidence and negative influence are supported. Although the opinions of users were collected at three different time points across 2018, the friendship networks were only obtained once in July 2018. Hence in the study we had dynamic opinions but static friendship networks. As the identified bounded confidence and negative influence in this study were based on friendship ties, we consider the exclusion of the dynamics of friendship networks a limitation of the study. However, even if the friendship networks were obtained together with the opinions at all time points, there still would be a problem that is pervasive in most studies using social media data: only influences from friends (in this case: the friends on VKontakte) are taken into account. This means the influences from acquaintances (e.g., colleagues and classmates), strangers, and those we dislike to various degrees but are still exposed to are left out. Intuitively, friends usually have similar opinions, so exclusively considering influences from friends will make it difficult to disentangle their influences from bounded confidence.
Our discussion has identified not only conflicting results but also methodological limitations shared by previous studies. The limitations can be divided into two categories. The first category concerns the external validity of the study. Members in this category include low stimulus frequency, short time span, sampling bias, and response bias. The other category relates to the study designs that are unable to explicitly detect the social influence mechanisms of interest, such as disentangling bounded confidence from negative influence, bounded confidence from influences from friends, and negative influence caused by opinion discrepancy from negative influence caused by disliking. Our study aims to address these limitations by combining field data on the co-evolution of opinions and friendship relations with a methodology, namely the Stochastic Actor-Oriented Model, that allows disentangling different social influence mechanisms from each other.
Methods
We use the Stochastic Actor-Oriented Model with a longitudinal data set consisting of many groups that tracks both social networks and opinions to assess the evidence of bounded confidence and negative influence in a field setting. The model and the data will be briefly introduced in this section. For a more extensive explanation of this model, consult Snijders (2017), Steglich et al. (2010), and the manual (Ripley et al. 2023).
Stochastic Actor-Oriented Model as an agent-based model
The Stochastic Actor-Oriented Model (SAOM) (Snijders 2001, 2017; Steglich et al. 2010) is a family of statistical models that can capture the role of various individual-level mechanisms in the dynamics of networks and behaviors. In our study, “opinion” plays the role of “behavior". Once the mechanisms are specified, the SAOM takes two or more waves of network data (here including one network and one behavioral variable) as inputs, and outputs the parameter estimate for each mechanism, representing how each mechanism contributes to the network and behavior changes from one wave to the next wave. The SAOM is a statistical model but also an agent-based model in disguise, as it assumes that the observed network and behavior changes are the collective results of the decisions of each agent (called”actor“, and represented by a node in the network). The link with agent-based models is elaborated in Snijders & Steglich (2015) and Steglich & Snijders (2022). To represent the observed changes between waves, a large number of sequential”ministeps" are put into the time gap between one observed wave and the next; in each ministep, an agent is randomly chosen to have an opportunity to change his/her network or behavior, and this changes the state of the system. The total number of ministeps between two consecutive waves, the chosen agent, and the variable that he/she is allowed to change in a particular ministep are all determined by the so-called rate functions. Rate functions determine how often agents have the opportunity to modify outgoing ties or behaviors, as a function of the observed changes in ties and opinions across the waves. In our study, there are two dependent variables – a network and a behavioral variable – so our model has two rate functions for each agent, each responsible for one dependent variable (Steglich et al. 2010). Importantly, both the rate functions as well as the parameters indicating how much the specified mechanism affected agents’ changes of behavior and of their ties are estimated from the data, distinguishing empirically estimated SAOM from theoretical ABM studies. Details can be found in Ripley et al. (2023).
The behavioral variable, \(o_i\) (\(i=1, \ldots, N\)), representing agent \(i\)’s opinion in our study, is assumed to have ordered integer values \(1, \ldots, K\) for some number \(K\). The state of the system consists here of the opinion \(o=\{o_1, \ldots, o_N\}\) combined with the network variable \(x\) and is denoted by \(y = (x,o)\). The network variable \(x\) is an \(N \times N\) matrix, where \(x_{ij}\) is the binary \(0\)-\(1\) indicator for the existence of a tie from agent \(i\) to agent \(j\). Suppose an agent, say agent \(i\), is chosen for a particular ministep and is allowed to change a dependent variable \(v\in\{x,o\}\); the agent then makes a decision, denoted by \(a_{vi}\), concerning \(v\) according to some objective function \(f_{vi}(y^0, y)\) that takes into account \(y^0\), the current state of the whole system, and \(y\), the state of the system after \(a_{vi}\) is executed. The agent has limited choices in one ministep: if he/she is allowed to change the network, the options are to create one new outgoing tie, terminate one existing outgoing tie, or do nothing; if he/she is allowed to change his/her own behavior, the options are to change his/her behavior by \(1\) unit on a given scale (given that the new behavior will still be in the permitted range), or do nothing. If \(a_{vi}\) is one of the compatible choices regarding \(v\) for agent \(i\), bringing state \(y^0\) to \(y\), the probability that the agent will make change \(a_{vi}\) is (Snijders 2017):
| \[ P_i(a_{vi}, y^0, y) = \frac{\exp(f_{vi}(y^0, y))}{\sum_{y^{\prime}}\exp(f_{vi}(y^0, y^{\prime}))} = \frac{\exp(f_{vi}(y^0, y) - f_{vi}(y^0, y^0))}{\sum_{y^{\prime}}\exp(f_{vi}(y^0, y^{\prime}) - f_{vi}(y^0, y^0))}\] | \[(6)\] |
The pre-specified mechanisms enter the dynamics via the objective function. The most convenient form of an objective function shall be (Snijders 2001, 2017):
| \[ f_{vi}(y^0, y) = \sum_k \beta_{vk} s_{vik}(y^0, y)\] | \[(7)\] |
The parameters \(\beta_{vk}\) are the same for all agents, but may differ between groups (in our study, classes) representing different independent networks. Examples of common effects that relate to network changes (henceforth called “network effects”) include reciprocity (the focal agent tends to create an outgoing tie to the other agent who has an existing outgoing tie to the focal agent), out-degree related activity (agents with many outgoing ties tends to create new outgoing ties), and same gender (agents are more likely to create outgoing ties to other agents of the same gender); examples of common effects of behavioral changes (henceforth called “behavior effects”) include linear shape (the general trend that the agent will adopt a behavioral variable of a higher value), quadratic shape (the tendency of agents with high (low) values of the behavioral variable to develop even higher (lower) values), and average similarity (the tendency that the agent’s behavioral variable will be closer to the median behavioral variable of those to whom the agent is tied via outgoing ties). In our case, the average similarity affect captures social influences from friends. Two new effects – namely \(\epsilon\)-near similarity and \(\kappa\)-far similarity – are introduced here to represent bounded confidence and negative influence, respectively. The new effects as well as other effects used in our study will be introduced in paragraphs 3.14-3.23.
The results of the SAOM analysis that we care about the most are the parameter estimates for the effects. For \(\beta_{vk}\), the parameter corresponding to effect \(s_{vik}\), its estimate is denoted by \(\hat{\beta}_{vk}\). Clearly, \(\beta_{vk}\) is the weight of \(s_{vik}\) in Equation (7). Therefore, a positive parameter indicates that the corresponding effect is a part of the network or opinion dynamics mechanism, while a negative parameter, on the contrary, indicates that the opposite of the effect takes part in the dynamics. This is further illustrated in paragraphs 4.3 and 4.4.
In this paper we use longitudinal data from multiple groups; this may be called a multilevel study of the dynamics of networks and behavior. We use a random coefficient multilevel model which assumes that the data in each group follows the SAOM according to a common model specification; some of the effect parameters vary between groups (the “random coefficients”), while others are constant across groups. The former parameters will be called group-varying, and the latter group-constant. The group-varying parameters are assumed to vary according to a multivariate normal distribution. For convenience, we also use the terms “group-varying” and “group-constant” for the corresponding effects.
For this data structure, the R package multiSiena (see Ripley et al. 2023) offers a Bayesian (e.g., Gill 2015) estimation procedure proposed in Koskinen & Snijders (2023). For the purpose of this paper, it suffices to mention that in Bayesian statistics the uncertainty about the parameters of the stochastic model is expressed by assuming that the parameters themselves have a probability distribution. Before having seen the data, this distribution is called the prior distribution; the statistical analysis uses the data to turn this into the posterior distribution, which represents our beliefs about the parameter values based on the data. The parameter estimate7 is the expected value of the posterior distribution. A high posterior probability that the parameter is positive indicates that the mechanism represented by the corresponding effect contributes to the observed changes of the relevant dependent variable across the waves, whereas a high posterior probability that it is negative indicates that the mechanism contributes to the changes in the opposite way. For example, a large posterior probability for positive values of the parameter for the effect representing the bounded confidence indicates empirical support for the bounded confidence mechanism in the data set being analyzed. If the posterior probability distribution for a parameter has large probabilities both for negative and for positive values, not close to zero, the data does not provide conclusive evidence about the presence of the effect or its converse.
As a final step of the Bayesian analysis, the goodness of fit of the estimated model can be assessed by the so-called posterior predictive checks. These check that, if parameters are sampled from the posterior distribution, the model would generate artificial data that are similar to the observed data. The posterior predictive checks will be used to simulate distributions of opinions and network dynamics based on the empirically estimated parameters of the micro-processes in our model, to further assess the results of the statistical analysis.
Data
In this study we use the data from the secondary school module of The Arnhem School Study (TASS) (Stark 2011; Stark & Flache 2012). TASS is a large-scale longitudinal survey study carried out in the Dutch city of Arnhem. It contains a primary school module (wave 1 - 3) and a follow-up secondary school module (wave 4 - 7). The latter includes four waves ranging from September 2008 (wave 4) to May 2010 (wave 7), within which we choose wave 5 and 6 as the input data of the SAOM. The choice follows Zingora et al. (2020) as wave 5 took place in December 2008, four months after the first day of secondary school so that the friendship networks should be formed by that time, and wave 6 took place in June 2009, the end of the school year so that the time gap between the two waves is long enough for friendship and opinion changes to happen. Wave 7 is excluded due to its relatively low response rate (\(75.5\%\); see Stark 2011), and the changes in class composition after wave 6 (Leszczensky et al. 2016). According to Stark (2011), all waves in the secondary school module involve \(12\) secondary schools, while wave 5 covers \(1246\) participants (response rate \(88.1\%\)) and wave 6 covers \(1220\) participants (response rate \(86\%\)). Since “almost all schools in Arnhem participated” (Stark 2011 p. 3), the data from TASS can be regarded as close-to-complete data of the entire cohort rather than a random sample or a “self-selected” sample (Leszczensky et al. 2016; Stark 2011), largely mitigating the sampling bias problem in previous studies.
The TASS data has recorded \(63\) classes before wave 7. Not all these classes will be used due to various considerations. In total, \(17\) classes are excluded from our study because either they did not participate in both waves, the data quality is questionable, or there were student transfers between these classes. Hence, the data selection procedure leaves us with \(46\) classes and \(1019\) adolescents, of whom \(991\) appear in both waves. This means our study includes around \(76.7\%\) of total classes that participated in both waves (\(N=60\)) and around \(75.8\%\) of the total population of these classes (\(N=1344\)). In the rest of the paper we only deal with the selected data (henceforth simply called “data”).
To keep our SAOM as concise as possible, given our interest in testing alternative mechanisms of social influence, we use the following information from the selected data in the SAOM:
- Class size: the number of adolescents in the class. Class sizes may vary from wave 5 to 6. Here we count everyone who was at least once a member of the class. Since we removed all the classes that involve student transfers, no adolescent will be counted more than once. The average class size is \(22.15\), and the standard deviation is \(5.80\). The largest class has \(30\) adolescents, and the smallest one has \(9\) adolescents. The size of adolescent \(i\)’s class is denoted by \(n_i\).
- Gender: the gender of each adolescent. It is either male (denoted by \(1\)) or female (denoted by \(0\)). There are \(537\) (\(52.7\%\)) males and \(459\) (\(45.0\%\)) females. The genders of the remaining \(23\) (around \(2.3\%\)) adolescents were not recorded. The gender of adolescent \(i\) is denoted by \(g_i=1\) if adolescent \(i\) is male, and \(g_i=0\) if \(i\) is female.
- Friend nomination: adolescents in the class that the respondent nominated as his/her best friends. There is no upper limit to the number of nominated best friends. Nominations were made in both waves. Based on the friend nominations, a directed friendship network for each class in each wave is constructed. These networks serve as the network variable as mentioned in the introduction of the SAOM. The network in wave \(t\) (\(t=5,6\)) is denoted by \(x(t)=\{x_{ij}(t)\}\), where \(x_{ij}(t)=1\) represents an outgoing tie from the agent \(i\) to another agent \(j\) while \(x_{ij}(t)=0\) means no such a tie. We will drop \(t\) and use \(x_{ij}\) when \(t\) can be learned from the context. On average, an adolescent nominated \(4.49\) (with the standard deviation of \(3.91\)) classmates as his/her best friends in wave 5, and \(4.35\) (with the standard deviation of \(3.94\)) classmates in wave 6. The average Jaccard index (Snijders et al. 2010) for class friendship networks is \(0.441\) between wave 5 and 6, with the standard deviation of \(0.116\).
- Opinions on the clothing style of rap/ hip hop: the self-reported opinions on rap/ hip hop clothing style, integer values ranging from \(1\) (dislike it the most) to \(5\) (like it the most)8. An opinion of \(3\) means the adolescent is neutral. In wave 5, the average opinion of all adolescents is \(3.23\), with the standard deviation of \(1.20\). In wave 6, the average opinion decreases to \(3.07\), with the standard deviation of \(1.11\). The average opinion change across wave 5 and 6 is \(-0.195\)9, with the standard deviation of \(1.058\). The opinion of each adolescent, denoted by \(o_i(t)\) for adolescent \(i\) in wave \(t\) (\(t=5,6\)), is used as the behavioral variable in the SAOM. As in the case of \(x_{ij}\), the notation of \(t\) will be dropped when it is obvious.
The choice of clothing style of rap/ hip hop is on one hand arbitrary to some extent given the large number of opinions available in the entire TASS data, and we by no means consider it the only feasible topic for our approach. In fact, applying the model to other topics is one of the avenues for future research we envisage. On the other hand, in terms of theoretical importance, the clothing taste/ choice of the youth is an enduring topic in youth/consumer behavior research (Badaoui et al. 2012; Piacentini & Mailer 2004; Smucker & Creekmore 1972), and the more general concept of cultural tastes serves as a synonym of “opinions” in studies of social influence (Axelrod 1997; Berger & Heath 2008; Flache & Macy 2011), particularly before the term “opinion dynamics” went popular.
Model specification
Network effects
Given that our network variable is the friendship network within each class, the SAOM effects that can capture the mechanisms governing friendship dynamics (i.e., formation, maintenance, and termination of ties) are included in the model. We restrict our model of the endogenous network processes to a small number of essential network effects that are commonly seen in the literature, since precise modeling of how adolescents make friends with their classmates is not our major interest (Boda et al. 2020; Koskinen & Snijders 2023; Leszczensky et al. 2016; Zingora et al. 2020). The network effects are the functions \(s_{vik}\) in Equation (7) for \(v=x\). We briefly explain these effects here in the context of this study and give their mathematical expressions (according to Ripley et al. 2023) in the parentheses after the names. Note that the expression “\(A\) considers \(B\) to be a friend” technically means “\(A\) sends a friendship tie to \(B\)”, and is represented by \(x_{AB}=1\). When we write “select friends”, this refers to creating new friendship ties in the ministeps and maintaining existing ones.
- Out-degree (density) effect (\(\sum_j x_{ij}\)) represents the general tendency to create new friendships in the class, balanced with terminating existing friendships. This has the role of an intercept.
- Reciprocity effect (\(\sum_j x_{ij}x_{ji}\)) represents the mechanism that an adolescent reciprocates friendship choices, meaning sending a friendship tie to those who have already sent himself/herself a friendship tie.
- Transitive triplets effect (\(\sum_{j,h}x_{ij}x_{ih}x_{hj}\)) represents the mechanism that an adolescent will select friends of friends as friends.
- Transitive reciprocated triplets effect (\(\sum_{j,h}x_{ij}x_{ji}x_{ih}x_{hj}\)) is the interaction between reciprocity and transitivity. According to Block (2015), a negative parameter value is expected here when the reciprocity and transitive triplets effects are also present, because the reciprocation mechanism contributes less to tie creation and maintenance of ties embedded in transitive triplets.
- In-degree related popularity effect (\(\sum_jx_{ij}\sum_h x_{hj}\)) represents the mechanism that an adolescent will select a classmate as a friend if he/she is already considered to be a friend by many others. In plain words, the effect describes the phenomenon that adolescents wish to be friends with popular classmates.
- Out-degree related activity effect (\((\sum_jx_{ij})^2\)) represents the mechanism that an adolescent who already considers many classmates to be friends will select more classmates to be friends.
- Reciprocal degree-related activity effect (\(\sum_jx_{ij}\sum_hx_{ih}x_{hi}\)) represents the mechanism that an adolescent who has already many reciprocated friendships will select more classmates as friends.
- Opinion similarity effect (\(\sum_jx_{ij}(sim^{o}_{ij}-\widehat{sim^{o}}\)), where the superscript \(o\) denotes the opinion on rap/ hip hop clothing style as described in paragraph 3.12. The term \(sim_{ij}^o=1-\big(|o_i-o_j|/\max_{hk}|o_h-o_k|\big)\) measures the similarity between adolescents \(i\) and \(j\) in terms of \(o\), and \(\widehat{sim^{o}}\) is the average \(sim_{ij}^o\) in the class.) represents the mechanism that classmates with opinions on the rap/ hip hop clothing style that are more similar to the agent’s opinion are more likely to be selected as friends.
- Log class size effect (\(\log n_i - \widehat{\log n}\), where \(\widehat{\log n}\) is the mean log class size of all classes in the data set), as the name indicates, controls the effect of class size on friendship network dynamics. A discussion on this effect can be found in Koskinen & Snijders (2023). A control for classroom size was included because it can be expected that the larger a classroom, the less well adolescents know and are aware of the opinions of all others in the classroom which, in turn, may affect social influence processes.
- Same gender effect (\(\sum_j x_{ij}I(g_i, g_j)\), where \(I(g_i, g_j)=1\) if \(g_i=g_j\), and \(0\) otherwise.) represents the mechanism that adolescents will consider a classmate of the same gender to be a friend.
Opinion effects
The behavioral variable in this study is adolescents’ opinions on the clothing style of rap/ hip hop, and hence we can call the behavior effects “opinion effects”, which are the functions \(s_{vik}\) for \(v=o\) in Equation (7).
We first include the following common opinion effects:
- Linear shape effect (\(o_i\)) is the behavioral counterpart of the out-degree (density) effect. It is like an intercept, representing the general trend to develop a more positive opinion towards the clothing style of rap/ hip hop.
- Quadratic shape effect (\((o_i-\mu)^2\), where \(\mu\) is the average observed opinion in the class across all waves) represents the mechanism that adolescents with extreme opinions (i.e., high values of \(|o_i-\mu|\)) are more likely to develop more extreme opinions than those with moderate opinions. When the parameter is negative, this represents “negative feedback, or a self-correcting mechanism” (Ripley et al. 2023 p. 52), which will be further addressed in paragraph 4.14.
- Average similarity effect (\(\big(\sum_jx_{ij}(sim_{ij}^o-\widehat{sim^o})\big)/\big(\sum_jx_{ij}\big)\), and \(0\) if \(\sum_jx_{ij}=0\).) indicates the influence from friends. To be precise, it represents the mechanism that an adolescent’s opinion will become closer to the median of his/her friends’ opinions. It is the only network-dependent opinion effect in our model.
In addition, two new effects were developed to capture bounded confidence and negative influence in the data (Ripley et al. 2023):
- \(\epsilon\)-near similarity effect (\(\sum_{j\neq i}\max(\epsilon-|o_j-o_i|, 0)\), where \(\epsilon\geq 1\) is an integer parameter10 specified by the modeler) represents the mechanism that an adolescent will become more similar (in terms of opinions) to those in the class whose opinion differences with his/hers are not larger than the given threshold \(\epsilon\). Notice that the symbol \(o_i\) in this notation does not refer to the current opinion of \(i\), but to a potential new opinion that agent \(i\) could adopt within the feasible range of opinions, i.e., maximally \(1\) unit below or above his/her current opinion on the scale.
Recall that the mathematical expression of an effect is a part of the objective function (Equation (7)). For agent \(i\) who has an opportunity in a ministep to change his/her opinion to \(o_i\), if the current state is \(y^0=(x^0, x^0)\) where \(o^0=\{o_1^0, \ldots, o_N^0\}\), this effect can be written as:
| \[ s_{oi{\rm (BC)}}(y)= \sum_{j\neq i}\max(\epsilon-|o_j-o_i|, 0) = \sum_{j\neq i}\max(\epsilon-|o_j^0-o_i|, 0)\] | \[(8)\] |
| \[ s_{oi{\rm (BC)}}(y) - s_{oi{\rm (BC)}}(y^0) = \#\{j \neq i: o^0_i < o^0_j \leq o^0_i + \epsilon\} - \#\{j \neq i: o^0_i - \epsilon < o^0_j \leq o^0_i\}\] | \[(9)\] |
The other effect is:
- \(\kappa\)-far similarity effect (\(\sum_{j\neq i}\min\{\kappa-|o_j-o_i|,0\}\)), where \(\kappa\geq 1\) is an integer parameter specified by the modeler) represents the mechanism that an adolescent will become more similar (in terms of opinions) to those in the class whose opinion differences with his/hers are no less than the given threshold \(\kappa\).
Analogous to Equation (9), we have:
| \[ s_{oi{\rm (NI)}}(y) - s_{oi{\rm (NI)}}(y^0) = \#\{j \neq i: o^0_j > o^0_i + \kappa\} - \#\{j \neq i: o^0_j \leq o^0_i - \kappa\}\] | \[(10)\] |
We present the following numerical examples to help better understand how \(\epsilon\)-near similarity and \(\kappa\)-far similarity work. The examples may be easier to understand with the demonstrations from Table 1. Suppose a population of \(5\) agents, starting with \(o^o_i=i, \forall i \in \{1,\ldots, 5\}\). We first focus on agent \(2\), whose current opinion is \(o^o_2=2\). In the SAOM framework, if he/she is chosen to update his/her opinion, then in the next ministep, \(o_2 \in \{1,2,3\}\), and \(o_i=o_i^o, \forall i \neq 2\). By denoting the state of the system in the next ministep as \(y(o_2)\) and setting \(\epsilon=1\), it is easy to work out that \(s_{o_2{\rm(BC)}}(y(o_2=1))=s_{o_2{\rm(BC)}}(y(o_2=3))=1\), and \(s_{o_2{\rm(BC)}}(y(o_2=2))=0\) according to Equation (8), meaning that if the system is purely driven by \(\epsilon\)-near similarity (with a positive parameter), \(o_2\) is equally likely to be \(1\) and \(3\), while unlikely to stay at \(2\). It is also easy to verify that if there are more agents in the population with opinions of \(3\) than those of \(1\), \(o_2=3\) will be preferred in this example. This example shows that \(\epsilon\)-near similarity drives an agent’s current opinion towards the opinions of others that are at least \(\epsilon\) unit different from the current opinion, in accordance with our statement in paragraph 3.17.
Similarly, by setting \(\kappa=3\), one can work out that \(s_{o_2{\rm(NI)}}(y(o_2=1))=-1\), and \(s_{o_2{\rm(NI)}}(y(o_2=2))=s_{o_2{\rm(NI)}}(y(o_2=3))=0\) for the same population, meaning that, if only \(\kappa\)-far similarity (with a positive parameter) is considered, \(o_2^o=2\) is equally likely to stay at \(o_2=2\) or increase to \(3\), but is unlikely to decrease to \(1\). We can say that only \(o_2=1\) is punished. In detail, for \(s_{o_2{\rm(NI)}}(y(o_2=1))=\sum_{j \neq 2}\min(\kappa-|o_j-o_2|)\), the only non-zero term in the summation on the right is \(\min(\kappa-|o_5-o_2|,0)=-1\); for \(s_{o_2{\rm(NI)}}(y(o_2=2))\) and \(s_{o2{\rm(NI)}}(y(o_2=3))\), all terms are zero. This implies that the punishment for \(o_2=1\) comes from \(o_5\), the only opinion from other agents whose absolute difference from (a possible value of) \(o_2\) is strictly larger than the threshold \(\kappa\). For \(o_2=2\) and \(o_2=3\), no such opinions exist. We can therefore tell that \(\kappa\)-far similarity punishes opinions in the next ministep whose absolute differences with (some) others’ opinions are strictly larger than the threshold \(\kappa\); the larger the absolute differences, the more severe the punishment. If \(\kappa\)-far similarity has a negative parameter, on the contrary, \(o_2=1\) will be rewarded, implying the mechanism of negative influence – driving an agent’s current opinion further away from the opinions of others that are at least \(\kappa\) units different from the current opinion. Readers are encouraged to work out cases where other agents update opinions.
| (a) \(\epsilon\)-near similarity | |||||
|---|---|---|---|---|---|
| Options for Agent 2 | \(bc(o_1,1)\) | \(bc(o_3,1)\) | \(bc(o_4,1)\) | \(bc(o_5,1)\) | \(s_{o_2\text{(BC)}}\) |
| Stay at \(o_2 = 2\) | 0 | 0 | 0 | 0 | 0 |
| Decrease to \(o_2 = 1\) | 1 | 0 | 0 | 0 | 1 |
| Increase to \(o_2 = 3\) | 0 | 1 | 0 | 0 | 1 |
| Note: \(bc(o_i,\epsilon) = \max(\epsilon - |o_2 - o_i|, 0)\), and \(s_{o_2\text{(BC)}} = \sum_{i \in \{1,3,4,5\}} bc(o_i, 1)\). | |||||
| (b) \(\kappa\)-far similarity | |||||
|---|---|---|---|---|---|
| Options for Agent 2 | \(ni(o_1,3)\) | \(ni(o_3,3)\) | \(ni(o_4,3)\) | \(ni(o_5,3)\) | \(s_{o_2\text{(NI)}}\) |
| Stay at \(o_2 = 2\) | 0 | 0 | 0 | 0 | 0 |
| Decrease to \(o_2 = 1\) | 0 | 0 | 0 | -1 | -1 |
| Increase to \(o_2 = 3\) | 0 | 0 | 0 | 0 | 0 |
| Note: \(ni(o_i,\kappa) = \min(\kappa - |o_2 - o_i|, 0)\), and \(s_{o_2\text{(NI)}} = \sum_{i \in \{1,3,4,5\}} ni(o_i, 1)\). | |||||
Note that in the same SAOM, \(\kappa\) shall be larger than \(\epsilon\). Otherwise the two effects will cancel out each other in the overlapping part on the opinion spectrum. In our study, the opinion ranges from \(1\) to \(5\), so both \(\epsilon\) and \(\kappa\) shall be no larger than \(4\), and by default at least \(1\), which leaves us with \(6\) theoretically possible combinations of \((\epsilon, \kappa)\): \((1,2)\), \((1,3)\), \((1,4)\), \((2,3)\), \((2,4)\), and \((3,4)\). Without running the model, we consider \((1,3)\) the combination that has the greatest potential to generate a reliable result due to the following reasons: (1) the 4-far similarity effect only involves adolescents with the most extreme opinions (i.e., \(1\) and \(5\)). Given the relatively small size of each class, the population of such adolescents is even smaller, and the parameter estimates obtained from them shall be less reliable compared to other \(\kappa\)-far similarity effects, and (2) \((1,2)\) and \((2,3)\) have less theoretical appeal than \((1,3)\) since in the models specified by \((1,2)\) and \((2,3)\), any adolescent is influenced by each of his/her classmates, either via \(\epsilon\)-near similarity or \(\kappa\)-far similarity. The model specified by \((1,3)\) instead allows us to capture the assumption of social judgment theory that classmates can have no influence on an adolescent because the opinion distance to them falls into the latitude of non-commitment. Nonetheless, we can not exclude other combinations a priori; instead, we argue that \((1,3)\) is the combination with the greatest potential. In the rest of the paper, this is the default setting unless stated otherwise.
SIENA and sienaBayes
The computer program used to run the SAOM (i.e., to obtain the parameter estimates of the SAOM given the model specification and data) is called SIENA, which stands for “Simulation Investigation of Empirical Network Analysis” (Ripley et al. 2023). On many occasions, the names SAOM and SIENA are used interchangeably. SIENA itself is implemented in R, and the relevant R packages are RSiena and multiSiena11.
Our data contains \(46\) classes and only the network/ opinion dynamics that happened within each class are included, meaning that each class can be independently modeled by its own SAOM. To obtain an overall picture of all classes, we estimate parameters of a multilevel SAOM for all classes combined using the function sienaBayes (Ripley et al. 2023). This approach uses the Bayesian method to estimate parameters according to a random coefficient model (see Koskinen & Snijders 2023). It requires to specify in advance which effects are group-varying and which are group-constant. For a group-varying effect, each class will have its own parameter value, and all classes will have the same parameter value for a group-constant effect. For the group-varying parameters, the hyperparameters are the global mean of the normal distribution of this parameter and its standard deviation, which is the between-class standard deviation.
To decide which effect parameters vary between classes and which are group-constant, the following considerations apply. Setting more effects to be group-varying will be more flexible and offer more information; but having too many group-varying effects will deteriorate the stability of estimation, and hence the reliability of the results (Ripley et al. 2023). Through trial and error based on the model specified by \(\epsilon=1\) and \(\kappa=3\) (see paragraph 3.23), a balance was found, and the following effects are set to be group-varying: out-degree (density), reciprocity, same gender, linear shape, quadratic shape, \(\epsilon\)-near similarity, and \(\kappa\)-far similarity. We call this model “the Main Model” henceforth. In the Appendix we will further discuss the prior for each effect parameter.
The estimation by sienaBayes is simulation-based, and to check the reliability of the result, its convergence needs to be checked. There are different ways to assess the convergence (see Ripley et al. 2023). Here we follow the “\(\hat{R}\) approach” based on Gelman et al. (2014) and described in Ripley et al. (2023): five prolonged estimation processes with identical settings are independently executed (by assigning each of them a different random number seed) as continuations of a previous run of the Main Model. The prolonged estimation processes have the same specification (in terms of data and effects) as the Main Model and use the result of the model as their common starting points. Then based on the five corresponding results we calculated the so-called “potential scale reduction factor” (Gelman et al. 2014 p. 287), denoted by \(\hat{R}\), to assess the convergence. If the convergence is acceptable – which is roughly evaluated by the condition \(\hat{R}\leq 1.10\) for all effects of interest (Gelman et al. 2014; Ripley et al. 2023) – the five results are glued together to form the final result. Otherwise, we can either further prolong each estimation process, or revise the model settings according to the assessment.
Advantages of the approach
By adopting the TASS data and the SAOM explained above, our approach addresses a number of the limitations of earlier studies discussed in paragraph 2.20. The use of data from a field study is the most noticeable feature of our approach and hence we can naturally avoid limitations related to laboratory experiments, including limited size of participants, low frequency of stimulus, short time span, and response bias. In addition, the sampling bias in our study shall be less worrisome since the TASS data is “close-to-complete” in the sense that almost the entire cohort was captured. Although we have removed some classes due to various concerns (see paragraph 3.11), this feature shall still be well-kept to a reasonable extent. To wrap up, this approach has an obvious advantage over others in terms of external validity.
The SAOM with the two newly developed effects – namely \(\epsilon\)-near similarity and \(\kappa\)-far similarity – is the highlight of this approach. The SAOM itself allows us to explicitly identify each of the pre-specified mechanisms from the data. By including the two new effects, we are then able to distinguish bounded confidence from negative influence. Including the remaining effects allows control for other simultaneous mechanisms that are known to affect network or opinion dynamics, including the influence from friends.
Results
Main results
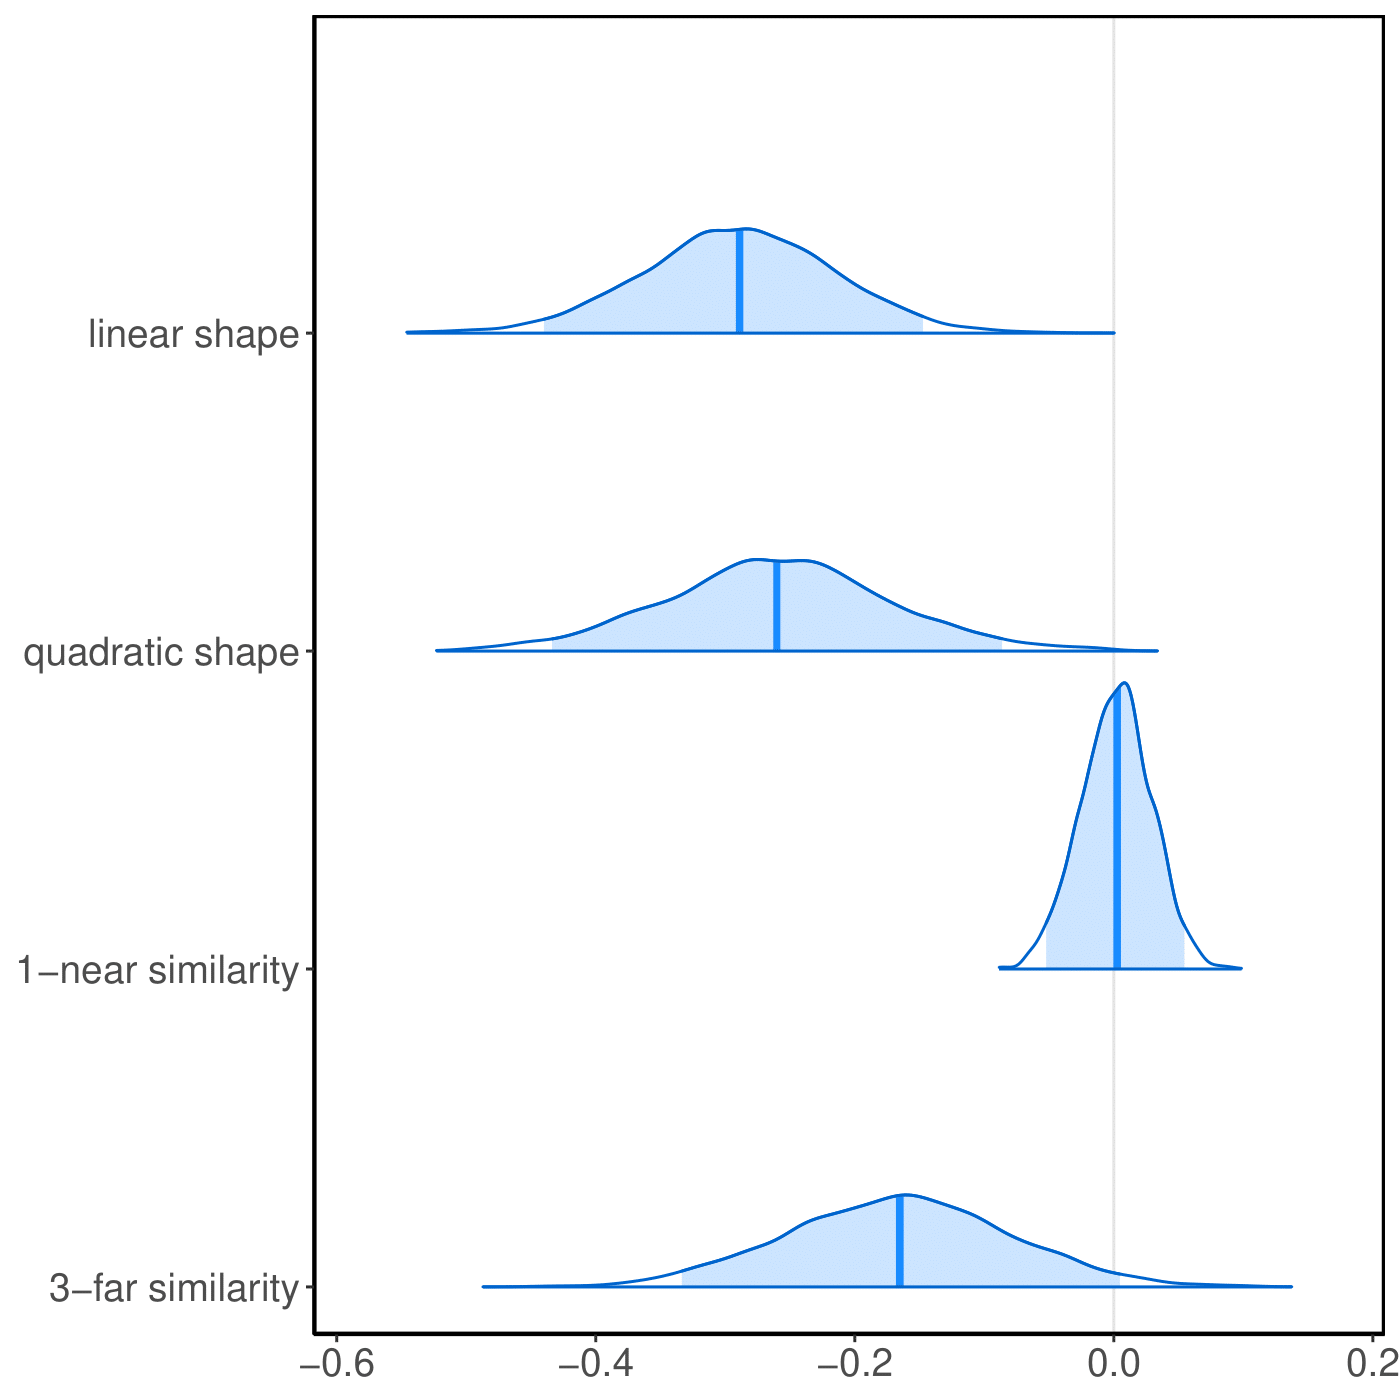
Table 2 shows the results of the parameter estimates (i.e., posterior means, \(p.m.\)) and relevant statistics of each effect of the Main Model specified by \(\epsilon=1\) and \(\kappa=3\) (henceforth called “Model A”). Among these statistics, we focus on \(p\), which is the posterior probability that the parameter is positive. In accordance with the explanations in paragraph 3.8, values of \(p\) very close to \(1\) signify support for the mechanism corresponding to a positive value of the parameter, while values of \(p\) very close to \(0\) signify support for the mechanism corresponding to a negative value of the parameter. Given this rule, we can see that all network effects and two opinion effects – linear shape and quadratic shape – have the values of \(p\) that are rounded to \(1.00\), \(0.01\), or \(0.00\), confirming their signs. Meanwhile, we are also quite confident that the 3-far similarity effect shall have a negative parameter (\(p=0.03\)), and the average similarity effect shall have a positive parameter (\(p=0.95\)). However, despite the positive estimate (\(p.m.=0.0018\)), we are unsure if the parameter of the 1-near similarity effect is positive or negative, given \(p=0.53\).
The signs of the parameter estimates for the common effects (i.e., all effects except 1-near similarity, 3-far similarity, and average similarity, which will be discussed later) are generally in agreement with our intuition and common knowledge in network/ behavioral science. For example, the negative parameter estimate for out-degree (density) implies that having friends or considering someone as a friend is costly, meaning that adolescents tend to avoid forming a tie unless this tie has some further positive effect on their objectives; the parameter estimates for opinion similarity and same gender being positive shows that adolescents are more likely to be friends if they have similar opinions or the same gender; the negative parameter estimate for log class size is in line with Koskinen & Snijders (2023).
| Effect | Feature | p.m. | p.s.d. | b.s.d. | p |
|---|---|---|---|---|---|
| out-degree (density) | Group-varying | -2.1250 | 0.0889 | 0.2916 | 0.00 |
| reciprocity | Group-varying | 2.2937 | 0.0924 | 0.3104 | 1.00 |
| transitive triplets | Group-constant | 0.3687 | 0.0167 | 1.00 | |
| transitive reciprocated triplets | Group-constant | -0.0603 | 0.0259 | 0.01 | |
| in-degree related popularity | Group-constant | -0.0894 | 0.0108 | 0.00 | |
| out-degree related activity | Group-constant | 0.0828 | 0.0057 | 1.00 | |
| reciprocal degree-related activity | Group-constant | -0.2567 | 0.0149 | 0.00 | |
| opinion similarity | Group-constant | 0.2405 | 0.0836 | 1.00 | |
| log class size | Group-constant | -0.3550 | 0.1589 | 0.01 | |
| same gender | Group-varying | 0.6124 | 0.0533 | 0.2051 | 1.00 |
| linear shape | Group-varying | -0.2903 | 0.0749 | 0.3379 | 0.00 |
| quadratic shape | Group-varying | -0.2598 | 0.0868 | 0.1655 | 0.00 |
| 1-near similarity | Group-varying | 0.0018 | 0.0272 | 0.0937 | 0.53 |
| 3-far similarity | Group-varying | -0.1664 | 0.0863 | 0.1796 | 0.03 |
| average similarity | Group-constant | 1.0573 | 0.6339 | 0.95 | |
| p.m. = posterior mean; p.s.d. = posterior standard deviation; | |||||
| b.s.d. = posterior between-groups standard deviation; | |||||
| p = posterior probability that the parameter is greater than 0. | |||||
| Effect | Feature | p.m. | p.s.d. | b.s.d. | p |
|---|---|---|---|---|---|
| out-degree (density) | Group-varying | -2.1191 | 0.0874 | 0.2869 | 0.00 |
| reciprocity | Group-varying | 2.2924 | 0.0908 | 0.3071 | 1.00 |
| transitive triplets | Group-constant | 0.3675 | 0.0157 | 1.00 | |
| transitive reciprocated triplets | Group-constant | -0.0570 | 0.0239 | 0.01 | |
| in-degree related popularity | Group-constant | -0.0905 | 0.0106 | 0.00 | |
| out-degree related activity | Group-constant | 0.0832 | 0.0058 | 1.00 | |
| reciprocal degree-related activity | Group-constant | -0.2583 | 0.0144 | 0.00 | |
| opinion similarity | Group-constant | 0.2723 | 0.0785 | 1.00 | |
| log class size | Group-constant | -0.3449 | 0.1552 | 0.01 | |
| same gender | Group-varying | 0.6148 | 0.0525 | 0.2022 | 1.00 |
| linear shape | Group-varying | -0.2931 | 0.0742 | 0.3378 | 0.00 |
| quadratic shape | Group-varying | -0.3375 | 0.0927 | 0.1764 | 0.00 |
| 1-near similarity | Group-varying | 0.0033 | 0.0285 | 0.0966 | 0.54 |
| 3-far similarity | Group-varying | -0.1740 | 0.0969 | 0.1856 | 0.04 |
| p.m. = posterior mean; p.s.d. = posterior standard deviation; | |||||
| b.s.d. = posterior between-groups standard deviation; | |||||
| p = posterior probability that the parameter is greater than 0. | |||||
Although the results of the network effects have provided ample information about how friendship evolved in classes, our focus is on the opinion effects, especially the last three effects in Table 2. As stated above, we are quite confident that the parameter estimate for 3-far similarity is negative, suggesting that – controlling for the other opinion effects – adolescents’ opinions were growing farther away from the median opinions of their classmates whose opinions are at least \(3\) units away from theirs. The parameter estimate for the 3-far similarity effect is \(\hat{\beta}_{NI}=-0.1664\). In one ministep of opinion dynamics (instead of “network dynamics”) for an adolescent \(i\), if \(f\) is the number of classmates with an opinion that is at least \(3\) units lower than \(i\)’s opinion and \(g\) is the number of classmates with an opinion more than \(3\) units higher, then Equation (10) implies that the contribution of the effect to the log probability of adolescent \(i\) increasing his/her opinion by \(1\) unit is \(\hat{\beta}_{NI}(g-f) = -0.1664(g-f)\). Since the range of opinions is \(4\), it should be noted that at least one of \(f\) and \(g\) must be \(0\). For example, if \(f=5\) and \(g=0\), the probability ratio of an increase by \(1\) unit (given that that is still within the feasible range) as compared to no change is \(\exp(5\times 0.1664)\approx 2.28\). Thus, there is sufficient evidence of negative influence in the data.
We are also quite confident that the parameter estimate for average similarity is positive, which means that the adolescents’ opinions – controlling for the other opinion effects – were moving closer to the median opinions of their friends. The parameter estimate for average similarity is \(\hat{\beta}_{AS}=1.0573\), and according to Ripley et al. (2023), the estimate means that in one ministep of opinion dynamics for an adolescent \(i\), the average similarity effect’s contribution to the log probability of increasing the opinion by \(1\) unit is \(\hat{\beta}_{AS}(c-a-b)/[r(a+b+c)]=1.0573(c-a-b)/[4(a+b+c)]\), given that \(a\), \(b\), and \(c\) are the number of \(i\)’s friends whose opinions are smaller than, equal to, and larger than \(i\)’s opinion, respectively, while \(r=4\) is the range of opinions. Therefore, if every friend of \(i\) has a more favorable opinion than \(i\) himself/herself, average similarity’s contribution to the probability ratio of increasing the opinion by \(1\) unit to keeping it unchanged is \(\exp(1.0573/4)\approx 1.30\).
The 1-near similarity effect has a \(p=0.53\), indicating that the corresponding parameter is not significantly different from zero, which is further confirmed by its close-to-zero estimate (\(0.0033\)). Therefore, we cannot find sufficient evidence of the mechanism of bounded confidence with the threshold of \(1\) playing a significant role in the opinion dynamics.
To summarize, the posterior distributions of the parameter estimates of the group-varying opinion effects are visualized in Figure 1.
When examining the list of effects in Table 2, one may raise a concern regarding the possible collinearity between 1-near similarity and average similarity, given that friends usually share similar minds. We run the same model as Model A but exclude the average similarity effect (henceforth called “Model B”). The results of Model B shown in Table 3 are not very different from the results of Model A in Table 2. Since in both models the parameter estimate for 1-near similarity is not significant (according to \(p\)), the increase from \(0.0018\) to \(0.0033\) does not really matter. Thus, the exclusion of the average similarity effect does not change our previous conclusions about 1-near similarity and 3-far similarity.
Two other opinion effects that find support both in Model A and Model B are the linear shape and quadratic shape effect. This further shows that a detailed understanding of the interplay of multiple, potentially competing micro-processes is needed to assess their exact implications for opinion polarization at the macro-level. The negative 3-far similarity effect signifies adolescents’ tendency to shift their opinions away from those they disagree with a lot, fostering polarization (all other things being equal). However, at the same time, the negative quadratic shape effect shows a tendency of adolescents holding opinions close to the extremes of \(1\) or \(5\) on the scale, to move towards more moderate opinions, regardless of outside influences. Whether and to what extent the interplay of these opposing dynamics entails opinion polarization in our classes will be analyzed in paragraphs 4.14-4.17.
Posterior predictive checks
The results presented in Table 2 and Table 3 have both passed the convergence assessment described in paragraph 3.27, and hence are reliable in terms of model convergence. In addition to that, we use the SAOM as a simulation tool to perform posterior predictive checks to assess how well the interplay of the micro-processes identified by our SAOM is capable of generating macro-outcomes that fit the observed data. The basic idea is to compare the observed data (i.e., the data used to yield the results) and data simulated on the basis of the empirically estimated model (Gelman et al. 2014). Since our research interests focus on opinions rather than networks, we make the comparison in terms of the mean opinion and – more importantly – the degree of opinion polarization of each class in our data. Multiple measurements have been proposed for polarization in empirical or simulated opinion data. For our purposes, we adopt three polarization measurements to ensure reliability – (1) the standard deviation, (2) an index introduced by (Flache & Macy 2011), here conveniently called the “Flache-Macy Index” (FM), (3) and the Equal-Size Binary Grouping Measurement (ESBGM) (Tang et al. 2022).
The Flache-Macy Index, in our context, is the variance of the opinion distances of every pair of adolescents in the same class (Flache & Macy 2011).12 Note that to use the index, we need to rescale the opinion variables \(o_i\in \{1,\ldots,5\}\) to \(\tilde{o}_i=-1+0.5(o_i-1)\) so that the rescaled opinion \(\tilde{o}_i\) is within the interval \([-1,1]\). The opinion polarization in class \(C\) in wave \(t\), \(P(C_t) \in [0,1]\), is:
| \[P(C_t)=\frac{1}{|C_t|^2}\sum_{i,j\in C_t}(d_{ij}-\bar{d}(C_t))^2\] | \[(11)\] |
To apply the ESBGM (Tang et al. 2022), we first divide the population into two equally sized groups \(G_1\) and \(G_2\), and calculate the between-group heterogeneity \(B\) and within-group heterogeneity \(W=W_1+W_2\), where \(W_k\) (\(k=1,2)\) is the within-group heterogeneity of group \(G_k\). Then the ESBGM is defined as \(f(W,B)\), a function that increases with \(B\) and decreases with \(W\). Here we choose to follow Tang et al. (2022), meaning: (1) \(f(W,B)=\frac{B}{\delta(W+1)}\), with \(\delta=16\) given that it is the largest possible squared distance in our study, (2) \(B\) is the squared distance between the mean opinions of the two groups, and (3) \(W_k\) is the sum of the squared distances between the opinions of members in \(G_k\) and the mean opinion of \(G_k\). Since only one variable (i.e., opinion) is involved, for each class we only need to divide the population by the median opinion. It remains unclear how to deal with the case when the size of the population is odd (Tang et al. 2022). For large data sets, it is usually of less importance as adding the member whose opinion is the closest to the median value to either group would have negligible impacts. In our study, the size of each class is rather small, so we decide to apply the ESBGM to both partitions of groups and take the average value.
Figure 2 visualizes the posterior predictive check results by comparing the simulated results (blue circles) and the observed results (red crosses) in wave 6 in terms of mean opinion and opinion polarization averaged over all classes. The simulated results were generated on the basis of the observed data in wave 5 by Model A, with the parameter estimates shown in Table 2. Regardless of the polarization measurements, the observed results lie within the boundary of the cloud formed by the simulated results in each of the three subplots, meaning that it is plausible for Model A to generate the observed result. Equivalently, this means Model A fits the data reasonably well across all three polarization measurements. In particular, there are \(43.72\%\) simulated results whose mean opinions are smaller than the observed result (in all three subplots). For opinion polarization, there are \(90.2\%\), \(96.56\%\), and \(36.76\%\) simulated results that are smaller than the observed results when they are measured by the standard deviation, the FM, and the ESBGM, respectively.
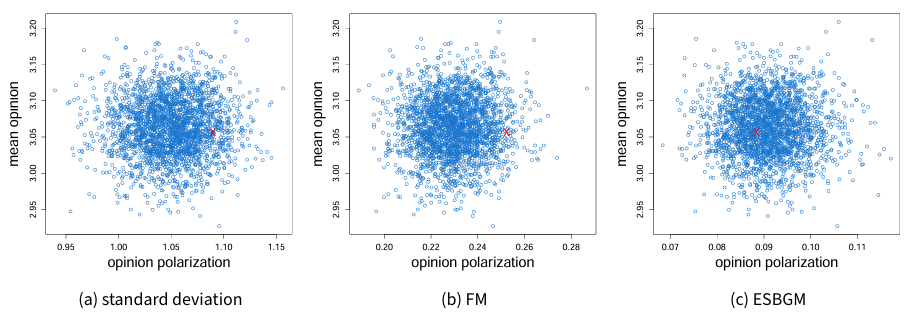
Importantly, the relatively low values we both observe and simulate for all three polarization measurements indicate that according to our model, the interplay of the simulated micro-processes does not generate a clear pattern of opinion polarization, reflecting the similarly low values computed from the empirical distributions. This implies that, despite the fact that we find evidence of negative influence at the micro-level in our data, competing processes, such as the self-correcting mechanism signified by the negative quadratic shape effect (see paragraph 4.14), may prevent populations from splitting into opposite factions.
Excluding quadratic shape effect
In both Model A and B, the parameter estimate for the quadratic shape effect is negative, meaning that adolescents with extreme opinions are more likely to become less extreme (i.e., “self-correcting mechanism”) (Ripley et al. 2023). Notice that this effect is unrelated to social influence: it indicates a general tendency to move towards the center of the opinion distribution in those adolescents who have adopted positions at one of the extreme ends. Such an “anti-polarization” effect hinders the polarization process of the system that could otherwise be induced by negative influence, adolescents’ tendency to move towards the opposite extreme of the opinion scale than those they disagree with a lot. We have already established that, at the macro-level, the interplay of all empirically supported micro-level processes in our model does not induce high levels of polarization. However, this still leaves the question open to what extent this can be attributed to the opposing forces of “self-correcting mechanism” and negative influence. To answer this question, we estimated a third model – Model C, which only differs from Model A by the exclusion of the quadratic shape effect. The results are shown in Table 4.
| Effect | Feature | p.m. | p.s.d. | b.s.d. | p |
|---|---|---|---|---|---|
| out-degree (density) | Group-varying | -2.1035 | 0.0901 | 0.2835 | 0.00 |
| reciprocity | Group-varying | 2.2880 | 0.0893 | 0.3111 | 1.00 |
| transitive triplets | Group-constant | 0.3673 | 0.0161 | 1.00 | |
| transitive reciprocated triplets | Group-constant | -0.0581 | 0.0251 | 0.01 | |
| in-degree related popularity | Group-constant | -0.0921 | 0.0111 | 0.00 | |
| out-degree related activity | Group-constant | 0.0827 | 0.0057 | 1.00 | |
| reciprocal degree-related activity | Group-constant | -0.2568 | 0.0143 | 0.00 | |
| opinion similarity | Group-constant | 0.2097 | 0.0795 | 1.00 | |
| log class size | Group-constant | -0.3432 | 0.1637 | 0.02 | |
| same gender | Group-varying | 0.6113 | 0.0531 | 0.2038 | 1.00 |
| linear shape | Group-varying | -0.2707 | 0.0731 | 0.3240 | 0.00 |
| 1-near similarity | Group-varying | 0.0321 | 0.0231 | 0.0883 | 0.92 |
| 3-far similarity | Group-varying | 0.0289 | 0.0576 | 0.1686 | 0.70 |
| average similarity | Group-constant | 1.9376 | 0.5466 | 1.00 | |
| p.m. = posterior mean; p.s.d. = posterior standard deviation; | |||||
| b.s.d. = posterior between-groups standard deviation; | |||||
| p = posterior probability that the parameter is greater than 0. | |||||
From Table 4 we see that both the 1-near and 3-far similarity effect have a positive parameter estimate in model C, though the estimate for the former (\(p=0.92\)) is more reliable than that of the latter (\(p=0.70)\). Compared to Model A (see Table 2), both estimates for 1-near and 3-far similarity are more “positive” in Model C. In addition, the estimate for the average similarity effect also increases. However, this does not weaken our previous conclusion that there is evidence of negative influence (but not for bounded confidence). The quadratic shape effect is commonly included in the SAOM to capture tendencies to avoid extreme behavior (when the parameter is negative) or be attracted by it (when the parameter is positive), independently from outside influences. Now that this control is removed, the model is forced to interpret the trend in terms of other opinion effects, including three effects of social influence: 1-near similarity, 3-far similarity, and average similarity. The positive estimates for all three effects induce a tendency of agents to adopt their opinions towards those of others they tend to agree with, those of others they disagree with, and those of their friends. Jointly, this implies a tendency to move towards the center of the overall opinion distribution given that none of the classes we observed is strongly polarized to begin with.
One may ask, if the three effects of social influence can also explain the trend, why don’t we just exclude the quadratic shape effect? The answer is two-fold. First, the quadratic shape effect is a “default” SAOM effect that should usually be included. Given that its estimate is significant in Model A, there is no good reason to exclude it. Second, the effect purely depends on one’s own opinions and is not related to social influences. So theoretically, the three effects of social influence cannot serve as substitutes of the quadratic shape effect.
If Model C is presented as the main outcome of the paper, people will come to the conclusion that there is evidence of bounded confidence but no evidence of negative influence, completely the opposite of our current conclusion from Model A. This leads us to reflect on existing empirical studies on bounded confidence and/or negative influence: it may be possible that the absence of controlling for the mechanism of “retracting” from extreme opinions represented by the quadratic shape effect may affect their conclusions to some degree. Meanwhile, we also reflect on the literature of opinion dynamics models, where not many models include an inherent tendency of agents to move away from extreme opinions once adopted. Especially for models of opinion polarization, this may be an interesting question to explore, because this tendency could mitigate polarization but also be overshadowed by a stronger force of negative influence or reinforcing influence, still inducing polarization at the macro-level.
Conclusions and Discussions
This paper presents an empirical and simulation investigation of bounded confidence and negative influence – two of the most prominent social influence mechanisms in opinion dynamics models – using the Stochastic Actor-Oriented Model (SAOM), in which bounded confidence and negative influence are represented by the newly developed SAOM effects: the \(\epsilon\)-near and \(\kappa\)-far similarity effect, respectively. We used these effects, together with other SAOM effects, to analyze the co-evolution of friendship networks and the attitude towards rap/ hip hop clothing styles in school classes investigated in the Arnhem School Study (TASS). SAOM results suggest that a model imposing a combination of a tendency to shift one’s opinion towards the opinions of adolescents one agrees with (bounded confidence) and a tendency to move away from opinions of adolescents one disagrees with (negative influence) (induced by \(\epsilon=1\) and \(\kappa=3\), where opinions range from \(1\) to \(5\)), while controlling for other potentially important mechanisms, among which is assimilative influence from friends, is a suitable description of the opinion dynamics. A further investigation shows no evidence of 1-near similarity effect, meaning that our data do not support the conclusion that opinion changes are driven by bounded confidence, with the threshold of \(1\). Meanwhile, the SAOM results support that the 3-far similarity effect, with a negative parameter estimate, plays a significant role in the opinion dynamics, providing empirical evidence of negative influence with the threshold of \(3\). Put differently, we find that in general, an adolescent did not have a significant tendency to conform to the median opinion of his/her like-minded classmates whose opinions are the same or \(1\) unit away from himself/herself, while he/she is likely to move away from those whose opinions are at least \(3\) units away from himself/herself, net of all other effects included in the model. To summarize, we have shown a new empirical test of two central mechanisms in agent-based models of opinion dynamics, providing empirical evidence of the absence of bounded confidence and the presence of negative influence. A strength of our study is that we could use field data and incorporate the co-evolution of network relations and opinions, as well as the co-occurrence of other mechanisms shaping opinions into our study. In this way, our study avoids some limitations of previous studies aiming to test micro-processes of opinion dynamics (see paragraph 2.20): the usage of the TASS data significantly improves the external validity by avoiding low stimulus frequency (between the two waves, students were expected to meet every school day), and short time span (there was about half a year between the two waves), while mitigating sampling (since the TASS data is close-to-complete) and response bias (since their answers were not supposed to be visible to other students); and the application of the SAOM helps us easily disentangle bounded confidence and negative influence from each other and from other mechanisms, such as the (assimilative) influences from friends.
Based on the empirically estimated micro-processes of both opinion and network changes in our data, we conducted further simulation studies. The posterior predictive checks (together with the convergence check) indicate that the results are trustworthy from a statistical perspective and that our model allows replicating the observed macro-level of opinion polarization in our data reasonably well. To be sure, this does not mean bounded confidence is absent in any circumstance nor that negative influence is present in all opinion dynamics processes. It should be noted that like most empirical studies of bounded confidence and/or negative influence, our investigation is purely about a particular group (first-year middle school students in Arnhem in 2010) and a particular topic (rap/ hip hop clothing style). In fact, one may not even confidently claim that bounded confidence never happened or negative influence actually happened in these classes back in 2010 in Arnhem. What we are certain about is that the results are the best description of the network and opinion dynamics as shown in the data, while alternative descriptions which we investigated (within the SAOM framework and given our approaches to determining thresholds for bounded confidence and negative influence) yield results indicating that these models provide a less accurate representation of the data.
The contribution of the investigation goes beyond the particular case in Arnhem. It presents a SAOM-based approach to obtaining empirically validated insights into the opinion dynamics process of interest, from which guidance on building agent-based models that link to the process can be derived. Since the SAOM itself is also a type of agent-based model, it would be of less necessity to build a “mainstream” (in the field of opinion dynamics) agent-based model to describe the same process using the guidance, yet agent-based models that aim to answer “what-if” questions can benefit from our SAOM results. For example, assuming that social influences won’t change dramatically with the class size within a certain range, one can build models with classes of various sizes while implementing relevant social influence mechanisms (e.g., bounded confidence and negative influence) according to Table 2. From such an empirically calibrated model, we could possibly gain more realistic understandings of the impact of class sizes on opinion polarization. Our analyses further highlighted that careful investigations of the interplay of multiple micro-level processes are needed before solid conclusions can be drawn about the impact that a particular process can have on polarization at the level of the population as a whole: while we did find support for negative influence, our further simulation analyses indicated that a simultaneous general tendency to retract from extreme opinions (“self-correcting mechanism”) in adolescents was strong enough to prevent high levels of polarization.
From the definitions of the \(\epsilon\)-near and \(\kappa\)-far similarity effects one may notice that both the bounded confidence threshold \(\epsilon\) and negative influence threshold \(\kappa\) remain the same for everyone in the SAOM. This “homogeneous thresholds” setting is in line with the common implementations of these two mechanisms in the opinion dynamics literature (Deffuant et al. 2000; Flache & Macy 2011; Hegselmann & Krause 2002; Turner & Smaldino 2018), yet a reasonable number of studies alternatively assume that the thresholds differ from agent to agent (Deffuant et al. 2002; Deffuant 2006; Lorenz 2010; Mathias et al. 2016; Weisbuch et al. 2002). The setting of heterogeneous thresholds shall be more realistic as the thresholds represent the openness towards other people’s opinions (Deffuant et al. 2002; Lorenz 2010). Moreover, the relation between the bounded confidence threshold and the extremeness of one’s opinion has been intensively studied as a part of the mechanisms that can explain polarization or extremism (Deffuant et al. 2002; Deffuant 2006). Implementing such a heterogeneous-threshold model in the SAOM framework will possibly unveil more details about how bounded confidence and negative influence shape opinions, which requires developing new effects to represent the mechanisms and extra efforts to estimate the thresholds for every agent.
Another avenue for future studies is to use the results obtained from our SAOM to analyze the relations between various factors and polarization. We know that theoretically bounded confidence and negative influence can both lead to or facilitate polarization, but do the data agree with us? From the TASS data, we know the opinion distributions in each class. Meanwhile, our SAOM has provided groupwise parameter estimates for each group-varying effect, including the 1-near and 3-far similarity effects. By considering the parameter estimate as a representative of the strength and direction of its corresponding effect, we can perform statistical investigations into their relations with polarization while controlling for other factors such as the class size. As a first-step attempt, we run simple linear regressions to see if or to what extent the groupwise SAOM parameter estimates (shown in Table 2) can explain changes in opinion polarization in each class between the two waves we investigated. Like what we’ve done in the posterior predictive checks, opinion polarization per wave is measured by the standard deviation, the Flache-Macy index (FM), and the Equal-Size Binary Grouping Measurement (EBSGM), leading to three linear regression models: LR-SD, LR-FM, and LR-ESBGM, respectively. The results are available in Table 5. The regression results of LR-SD and LR-FM generally support our intuition that the quadratic shape effect is positively related to increases of polarization while the 3-far similarity effect is negatively related to it. In other words, the less the data in a specific class suggest regression of opinions to the mean and the more they suggest negative influence, the more polarization increases (or the less it decreases) over time. The results about 1-near similarity might be less reliable since according to Table 2, its parameter estimate is not significant. While these regression analyses are only explorative (and naturally, more sophisticated models may be required to draw solid conclusions), they point to further ways how SAOM results can be employed to interpret the effects of different micro-processes on opinion polarization.
| LR-SD | LR-FM | LR-ESBGM | ||||||||||
|---|---|---|---|---|---|---|---|---|---|---|---|---|
| estimate | SE | estimate | SE | estimate | SE | |||||||
| intercept | 0.2009 | 0.3929 | 0.1520 | 0.2054 | -0.1092 | 0.1408 | ||||||
| out-degree (density) | 0.0281 | 0.1432 | 0.0403 | 0.0748 | -0.0516 | 0.0513 | ||||||
| reciprocity | -0.0407 | 0.0965 | -0.0588 | 0.0504 | 0.0029 | 0.0346 | ||||||
| same gender | 0.4068 | 0.2514 | 0.3283* | 0.1314 | -0.0887 | 0.0901 | ||||||
| linear shape | 0.2121 | 0.1474 | 0.1829* | 0.0770 | -0.0536 | 0.0528 | ||||||
| quadratic shape | 3.4543*** | 0.5443 | 1.6017*** | 0.2845 | 0.2827 | 0.1951 | ||||||
| 1-near similarity | -1.4247 | 0.7862 | 0.2879 | 0.4110 | -0.7100* | 0.2819 | ||||||
| 3-far similarity | -1.7987** | 0.5210 | -1.1313*** | 0.2724 | -0.1094 | 0.1868 | ||||||
| class size | 0.0133*** | 0.0037 | 0.0053** | 0.0019 | 0.0034* | 0.0013 | ||||||
| adjusted R-squared | 0.7127 | 0.6259 | 0.3426 | |||||||||
| significance ***: p<0.001; **: p<0.01; *: p<0.05 | ||||||||||||
| LR-SD: linear regression model using the standard deviation; | ||||||||||||
| LR-FM: linear regression model using the Flache-Macy index (FM); | ||||||||||||
| LR-ESBGM: linear regression model using the Equal-Size Binary Grouping Measurement (ESBGM); | ||||||||||||
| The groupwise parameter estimates are obtained from Model A. | ||||||||||||
Appendix
The prior distribution for the Bayesian estimation was determined in accordance with the RSiena manual (Ripley et al. 2023 Section 11.4.5). The prior distribution for the group-constant parameters was a flat prior. For the group-varying parameters, the prior was the conjugate prior for multivariate normal distribution with unknown mean and unknown covariance matrix (Gelman et al. 2014 Section 3.6). For the precise distributional description we refer to the RSiena manual; here we give a more intuitive description. For the population mean of all group-varying parameters we assumed a value \(0\), except for the out-degree (density), reciprocity, and same gender parameters; these had prior means, respectively, of \(-2.0\), \(2.0\), and \(0.4\). The values \(0\) were chosen not to bias the results toward either positive or negative values, and the non-zero values are in accordance with experience for friendship networks. For the prior variance of all population mean parameters we assumed a value of \(1\), which is quite wide given that parameters of the Stochastic Actor-oriented Model for these effects usually are much smaller in absolute value than \(1\); this is with the exception of the out-degree (density) and linear shape effects, which have the role of the intercept in these models, and for which a prior variance of \(10\) was assumed. The priors for the variance between the groupwise parameters were \(100\) times smaller than the prior variance for the population mean parameters, to express that the groups come from the same population and the groupwise parameters will accordingly be rather similar.Notes
- By the general term “assimilation” or “assimilative influence”, we do not specify if this mechanism only occurs between friends/ connected agents, or occurs between anyone; otherwise, we will explicitly mention the condition, such as "assimilative influence from friends".↩︎
- If a social network is not connected, then assimilative influence may lead to convergence on different opinions in different components of a network; see Flache et al. (2017) for an overview.↩︎
- Some implementations also allow the possibility that the opinion temporarily shifts towards that of the source of influence, but in such a way that the eventual disagreement is larger than it was before; see, e.g., Chan et al. (2022).↩︎
- The concept of “effects” in the SAOM will be introduced in Section 3.↩︎
- However, bounded confidence is not considered an “assimilative influence” mechanism at least in this paper, since the latter does not depend on the opinion differences between agents.↩︎
- In the original model (Flache & Macy 2011), the focal agent \(i\) will be influenced by all its neighbors at the same time. To better illustrate the dynamics, here we limit the number of neighbors of agent \(i\) to one.↩︎
- To be precise, this is the point estimate of the parameter, though “point” is conventionally omitted in the SAOM.↩︎
- The original question (in Dutch) in the survey is: Geef je mening: Wat vind je van deze kledingstijl? Rap/ hip hop: 1-Erg stom, 2-Stom, 3-Maakt niet uit, 4-Goed, 5-Erg goed. This roughly translates to: Give your opinion: how do you like this clothing style? Rap/ hip hop: 1-Very stupid, 2-Stupid, 3-Does not matter, 4-Good, 5-Very good.↩︎
- Note that this does not agree with the difference between average opinions in wave 5 (\(3.23\)) and 6 (\(3.07\)) because some adolescents’ responses are only available in one wave.↩︎
- If \(\epsilon=0\), \(\max(\epsilon-|o_j-o_i|, 0)\) will always be zero, and hence the effect is meaningless.↩︎
- See https://www.stats.ox.ac.uk/~snijders/siena/.↩︎
- A mathematically simplified version has been introduced by Flache (2019) and is used here too in a slightly adapted way.↩︎
Acknowledgements
The authors acknowledge the financial support by the Netherlands Organization for Scientific Research (NWO) under the 2018 ORA grant ToRealSim (464.18.112). The authors are sincerely grateful to the anonymous reviewers for providing helpful comments and suggestions. In some cases, we gratefully adopted text suggestions given by the reviewers. The authors especially thank Tibor Zingora (University of Groningen) and Tobias Stark (Utrecht University) for programming advice and data explanation. The work was technologically supported by the high performance computing cluster Peregrine and Hábrók provided by the Center for Information Technology of the University of Groningen.References
ARONSON, E., Turner, J. A., & Carlsmith, J. M. (1963). Communicator credibility and communication discrepancy as determinants of opinion change. The Journal of Abnormal and Social Psychology, 67(1), 31–36. [doi:10.1037/h0045513]
AXELROD, R. (1997). The dissemination of culture: A model with local convergence and global polarization. Journal of Conflict Resolution, 41(2), 203–226. [doi:10.1177/0022002797041002001]
AXELROD, R., Daymude, J. J., & Forrest, S. (2021). Preventing extreme polarization of political attitudes. Proceedings of the National Academy of Sciences, 118(50), e2102139118. [doi:10.1073/pnas.2102139118]
BADAOUI, K., Lebrun, A.-M., & Bouchet, P. (2012). Clothing style, music, and media influences on adolescents’ brand consumption behavior. Psychology & Marketing, 29(8), 568–582. [doi:10.1002/mar.20544]
BAIL, C. A., Argyle, L. P., Brown, T. W., Bumpus, J. P., Chen, H., Hunzaker, M. B. F., Lee, J., Mann, M., Merhout, F., & Volfovsky, A. (2018). Exposure to opposing views on social media can increase political polarization. Proceedings of the National Academy of Sciences, 115(37), 9216–9221. [doi:10.1073/pnas.1804840115]
BALDASSARRI, D., & Bearman, P. (2007). Dynamics of political polarization. American Sociological Review, 72(5), 784–811. [doi:10.1177/000312240707200507]
BERGER, J., & Heath, C. (2008). Who drives divergence? Identity signaling, outgroup dissimilarity, and the abandonment of cultural tastes. Journal of Personality and Social Psychology, 95(3), 593–607. [doi:10.1037/0022-3514.95.3.593]
BERGER, R. L. (1981). A necessary and sufficient condition for reaching a consensus using DeGroot’s method. Journal of the American Statistical Association, 76(374), 415–418. [doi:10.1080/01621459.1981.10477662]
BLOCK, P. (2015). Reciprocity, transitivity, and the mysterious three-cycle. Social Networks, 40, 163–173. [doi:10.1016/j.socnet.2014.10.005]
BODA, Z., Néray, B., & Snijders, T. A. B. (2020). The dynamics of interethnic friendships and negative ties in secondary school: The role of peer-Perceived ethnicity. Social Psychology Quarterly, 83(4), 342–362. [doi:10.1177/0190272520907594]
BOURDIEU, P. (1984). Distinction: A Social Critique of the Judgement of Taste. Cambridge, MA: Harvard University Press.
BRACEGIRDLE, C., Reimer, N. K., van Zalk, M., Hewstone, M., & Wölfer, R. (2022). Disentangling contact and socialization effects on outgroup attitudes in diverse friendship networks. Journal of Personality and Social Psychology: Attitudes and Social Cognition, 122(1), 1–15. [doi:10.1037/pspa0000240]
BRECHWALD, W. A., & Prinstein, M. J. (2011). Beyond homophily: A decade of advances in understanding peer influence processes. Journal of Research on Adolescence, 21(1), 166–179. [doi:10.1111/j.1532-7795.2010.00721.x]
CASTELLANO, C., Fortunato, S., & Loreto, V. (2009). Statistical physics of social dynamics. Reviews of Modern Physics, 81(2), 591–646. [doi:10.1103/revmodphys.81.591]
CHAN, K. M. D., Duivenvoorden, R., Flache, A., & Mandjes, M. (2022). A relative approach to opinion formation. The Journal of Mathematical Sociology, 48(1), 1–41. [doi:10.1080/0022250x.2022.2036142]
CORNACCHIA, E., Singer, N., & Abbe, E. (2020). Polarization in attraction-Repulsion models. 2020 IEEE International Symposium on Information Theory (ISIT) [doi:10.1109/isit44484.2020.9174010]
DEFFUANT, G. (2006). Comparing extremism propagation patterns in continuous opinion models. Journal of Artificial Societies and Social Simulation, 9(3), 8.
DEFFUANT, G., Amblard, F., Weisbuch, G., & Faure, T. (2002). How can extremism prevail? A study based on the relative agreement interaction model. Journal of Artificial Societies and Social Simulation, 5(4), 1.
DEFFUANT, G., Neau, D., Amblard, F., & Weisbuch, G. (2000). Mixing beliefs among interacting agents. Advances in Complex Systems, 3(01n04), 87–98. [doi:10.1142/s0219525900000078]
DEGROOT, M. H. (1974). Reaching a consensus. Journal of the American Statistical Association, 69(345), 118–121. [doi:10.1080/01621459.1974.10480137]
DEUTSCH, M., & Gerard, H. B. (1955). A study of normative and informational social influences upon individual judgment. The Journal of Abnormal and Social Psychology, 51(3), 629–636. [doi:10.1037/h0046408]
DITTMER, J. C. (2001). Consensus formation under bounded confidence. Nonlinear Analysis: Theory, Methods & Applications, 47(7), 4615–4621. [doi:10.1016/s0362-546x(01)00574-0]
EAGLY, A. H., & Telaak, K. (1972). Width of the latitude of acceptance as a determinant of attitude change. Journal of Personality and Social Psychology, 23(3), 388–397. [doi:10.1037/h0033161]
FELICIANI, T., Flache, A., & Tolsma, J. (2017). How, when and where can spatial segregation induce opinion polarization? Two competing models. Journal of Artificial Societies and Social Simulation, 20(2), 6. [doi:10.18564/jasss.3419]
FESTINGER, L. (1957). A Theory of Cognitive Dissonance. Stanford, CA: Stanford University Press.
FLACHE, A., & Macy, M. W. (2006). Why more contact may increase cultural polarization. arXiv prepirnt. 10.48550/arXiv.physics/0604196
FLACHE, A., & Macy, M. W. (2011). Small worlds and cultural polarization. The Journal of Mathematical Sociology, 35(1–3), 146–176. [doi:10.1080/0022250x.2010.532261]
FLACHE, A., & Mäs, M. (2008). How to get the timing right. A computational model of the effects of the timing of contacts on team cohesion in demographically diverse teams. Computational & Mathematical Organization Theory, 14, 23–51. [doi:10.1007/s10588-008-9019-1]
FLACHE, A., Mäs, M., Feliciani, T., Chattoe-Brown, E., Deffuant, G., Huet, S., & Lorenz, J. (2017). Models of social influence: Towards the next frontiers. Journal of Artificial Societies and Social Simulation, 20(4), 2. [doi:10.18564/jasss.3521]
FREEDMAN, J. L. (1964). Involvement, discrepancy, and change. The Journal of Abnormal and Social Psychology, 69(3), 290–295. [doi:10.1037/h0042717]
FRENCH Jr., J. R. P. (1956). A formal theory of social power. Psychological Review, 63(3), 181–194. [doi:10.1037/h0046123]
GELMAN, A., Carlin, J. B., Stern, H. S., Dunson, D. B., Vehtari, A., & Rubin, D. B. (2014). Bayesian Data Analysis. Boca Raton, FL: Chapman & Hall/CRC. [doi:10.1201/b16018]
GILL, J. (2015). Bayesian Methods: A Social and Behavioral Sciences Approach. Boca Raton, FL: Chapman & Hall/CRC.
GOLDBERG, S. C. (1954). Three situational determinants of conformity to social norms. The Journal of Abnormal and Social Psychology, 49(3), 325–329. [doi:10.1037/h0056249]
HEGSELMANN, R. (2023). Bounded confidence revisited: What we overlooked, underestimated, and got wrong. Journal of Artificial Societies and Social Simulation, 26(4), 11. [doi:10.18564/jasss.5257]
HEGSELMANN, R., & Krause, U. (2002). Opinion dynamics and bounded confidence: Models, analysis and simulation. Journal of Artificial Societies and Social Simulation, 5(3), 2.
HEIDER, F. (1946). Attitudes and cognitive organization. The Journal of Psychology, 21(1), 107–112.
HOVLAND, C. I., Harvey, O. J., & Sherif, M. (1957). Assimilation and contrast effects in reactions to communication and attitude change. The Journal of Abnormal and Social Psychology, 55(2), 244–252. [doi:10.1037/h0048480]
HOVLAND, C. I., & Pritzker, H. A. (1957). Extent of opinion change as a function of amount of change advocated. The Journal of Abnormal and Social Psychology, 54(2), 257–261. [doi:10.1037/h0042867]
HUET, S., Deffuant, G., & Jager, W. (2008). A rejection mechanism in 2D bounded confidence provides more conformity. Advances in Complex Systems, 11(04), 529–549. [doi:10.1142/s0219525908001799]
JAGER, W., & Amblard, F. (2005). Uniformity, bipolarization and pluriformity captured as generic stylized behavior with an agent-based simulation model of attitude change. Computational & Mathematical Organization Theory, 10, 295–303. [doi:10.1007/s10588-005-6282-2]
KEIJZER, M., Mäs, M., & Flache, A. (2024). Polarization on social media: Micro-Level evidence and macro-Level implications. Journal of Artificial Societies and Social Simulation, 27(1), 7. [doi:10.18564/jasss.5298]
KOSKINEN, J., & Snijders, T. A. B. (2023). Multilevel longitudinal analysis of social networks. Journal of the Royal Statistical Society Series A: Statistics in Society, 186(3), 376–400. [doi:10.1093/jrsssa/qnac009]
KOZITSIN, I. V. (2023). Opinion dynamics of online social network users: A micro-level analysis. The Journal of Mathematical Sociology, 47(1), 1–41. [doi:10.1080/0022250x.2021.1956917]
KRAUSE, U. (2000). A discrete nonlinear and non-autonomous model of consensus formation. In S. Elyadi, G. Ladas, J. Popenda, & J. Rakowski (Eds.), Communications in Difference Equations (pp. 227–236). Amsterdam: Gordon & Breach.
LAURSEN, B., & Veenstra, R. (2021). Toward understanding the functions of peer influence: A summary and synthesis of recent empirical research. Journal of Research on Adolescence, 31(4), 889–907. [doi:10.1111/jora.12606]
LESZCZENSKY, L., Stark, T. H., Flache, A., & Munniksma, A. (2016). Disentangling the relation between young immigrants’ host country identification and their friendships with natives. Social Networks, 44, 179–189. [doi:10.1016/j.socnet.2015.08.001]
LIU, S., Mäs, M., Haoxiang, X., & Flache, A. (2022). When intuition fails: The complex effects of the assimilative and repulsive influence on opinion polarization. Advances in Complex Systems, 25(08), 2250011. [doi:10.1142/s0219525922500114]
LORENZ, J. (2010). Heterogeneous bounds of confidence: Meet, discuss and find consensus! Complexity, 15(4), 43–52. [doi:10.1002/cplx.20295]
MACKIE, D. M. (1986). Social identification effects in group polarization. Journal of Personality and Social Psychology, 50(4), 720–728. [doi:10.1037//0022-3514.50.4.720]
MACY, M. W., Kitts, J. A., Flache, A., & Benard, S. (2003). Polarization in dynamic networks: A Hopfield model of emergent structure. In R. Breiger, K. Carley, & P. Pattison (Eds.), Dynamic Social Network Modeling and Analysis (pp. 162–173). Washington, DC: The National Academies Press.
MARK, N. P. (2003). Culture and competition: Homophily and distancing explanations for cultural niches. American Sociological Review, 68(3), 319–345. [doi:10.2307/1519727]
MÄS, M., & Bischofberger, L. (2015). Will the personalization of online social networks foster opinion polarization?SSRN prepirnt. Available at: https://dx.doi.org/10.2139/ssrn.2553436 [doi:10.2139/ssrn.2553436]
MÄS, M., & Flache, A. (2013). Differentiation without distancing. Explaining bi-polarization of opinions without negative influence. PLoS One, 8(11), e74516.
MÄS, M., Flache, A., & Helbing, D. (2010). Individualization as driving force of clustering phenomena in humans. PLoS Computational Biology, 6(10), 1–8.
MATHIAS, J.-D., Huet, S., & Deffuant, G. (2016). Bounded confidence model with fixed uncertainties and extremists: The opinions can keep fluctuating indefinitely. Journal of Artificial Societies and Social Simulation, 19(1), 6. [doi:10.18564/jasss.2967]
MCPHERSON, M., Smith-Lovin, L., & Cook, J. M. (2001). Birds of a feather: Homophily in social networks. Annual Review of Sociology, 27(1), 415–444. [doi:10.1146/annurev.soc.27.1.415]
NICKERSON, R. S. (1998). Confirmation bias: A ubiquitous phenomenon in many guises. Review of General Psychology, 2(2), 175–220. [doi:10.1037//1089-2680.2.2.175]
NYHAN, B., & Reifler, J. (2010). When corrections fail: The persistence of political misperceptions. Political Behavior, 32, 303–330. [doi:10.1007/s11109-010-9112-2]
PIACENTINI, M., & Mailer, G. (2004). Symbolic consumption in teenagers’ clothing choices. Journal of Consumer Behaviour, 3(3), 251–262. [doi:10.1002/cb.138]
RADILLO-DÍAZ, A., Pérez, L. A., & del Castillo-Mussot, M. (2009). Axelrod models of social influence with cultural repulsion. Physical Review E, 80(6), 066107.
RIPLEY, R. M., Snijders, T. A. B., Boda, Z., Vörös, A., & Preciado, P. (2023). Manual for RSiena (version September 29, 2023). Oxford: University of Oxford, Department of Statistics; Nuffeld College
SARUP, G., Suchner, R. W., & Gaylord, G. (1991). Contrast effects and attitude change: A test of the two-stage hypothesis of social judgment theory. Social Psychology Quarterly, 54(4), 364–372. [doi:10.2307/2786848]
SHERIF, C. W., Kelly, M., Rodgers, Jr., H. L., Sarup, G., & Tittler, B. I. (1973). Personal involvement, social judgment, and action. Journal of Personality and Social Psychology, 27(3), 311–328. [doi:10.1037/h0034948]
SHERIF, C. W., SHERIF, M., & Nebergal, R. E. (1965). Attitude and Attitude Change: The Social Judgment-Involvement Approach. Philadelphia, PA: Saunders.
SHERIF, M. (1960). Some needed concepts in the study of social attitudes. In J. G. Peatman & E. L. Hartley (Eds.), Festschrift for Gardner Murphy (pp. 194–213). New York, NY: Harper.
SHERIF, M., & Hovland, C. I. (1961). Social Judgment: Assimilation and Contrast Effects in Communication and Attitude Change. New Haven, CT: Yale University Press.
SHERIF, M., & SHERIF, C. W. (1967). Attitude as the individual’s own categories: The social judgment-involvement approach to attitude and attitude change. In C. W. Sherif & M. Sherif (Eds.), Attitude, Ego-Involvement, and Change (pp. 105–139). Hoboken, NJ: John Wiley & Sons.
SMUCKER, B., & Creekmore, A. M. (1972). Adolescents’ clothing conformity, awareness, and peer acceptance. Home Economics Research Journal, 1(2), 92–97. [doi:10.1177/1077727x7200100203]
SNIJDERS, T. A. B. (2001). The statistical evaluation of social network dynamics. Sociological Methodology, 31(1), 361–395. [doi:10.1111/0081-1750.00099]
SNIJDERS, T. A. B. (2017). Stochastic actor-Oriented models for network dynamics. Annual Review of Statistics and Its Application, 4(1), 343–363. [doi:10.1146/annurev-statistics-060116-054035]
SNIJDERS, T. A. B., & Steglich, C. E. G. (2015). Representing micro-Macro linkages by actor-based dynamic network models. Sociological Methods & Research, 44(2), 222–271. [doi:10.1177/0049124113494573]
SNIJDERS, T. A. B., van de Bunt, G. G., & Steglich, C. E. G. (2010). Introduction to stochastic actor-based models for network dynamics. Social Networks, 32(1), 44–60. [doi:10.1016/j.socnet.2009.02.004]
STARK, T. H. (2011). The Arnhem School Study (TASS) Secondary School Module. DANS Data Station Social Sciences and Humanities. https://doi.org/10.17026/dans-zc6-jhdk
STARK, T. H., & Flache, A. (2012). The double edge of common interest: Ethnic segregation as an unintended byproduct of opinion homophily. Sociology of Education, 85(2), 179–199. [doi:10.1177/0038040711427314]
STEGLICH, C. E. G., & Snijders, T. A. B. (2022). Stochastic network modeling as generative social science. In K. Gërxhani, N. D. de Graaf, & W. Raub (Eds.), Handbook of Sociological Science. Cheltenham: Edward Elgar Publishing. [doi:10.4337/9781789909432.00012]
STEGLICH, C. E. G., Snijders, T. A. B., & Pearson, M. (2010). Dynamic networks and behavior: Separating selection from influence. Sociological Methodology, 40(1), 329–393. [doi:10.1111/j.1467-9531.2010.01225.x]
TAKÁCS, K., Flache, A., & Mäs, M. (2016). Discrepancy and disliking do not induce negative opinion shifts. PLoS One, 11(6), e0157948.
TANG, T., Ghorbani, A., Squazzoni, F., & Chorus, C. G. (2022). Together alone: A group-based polarization measurement. Quality & Quantity, 56, 3587–3619. [doi:10.1007/s11135-021-01271-y]
TURNER, M. A., & Smaldino, P. E. (2018). Paths to polarization: How extreme views, miscommunication, and random chance drive opinion dynamics. Complexity, 2018. [doi:10.1155/2018/2740959]
VAN KNIPPENBERG, A., & Wilke, H. (1988). Social categorization and attitude change. European Journal of Social Psychology, 18(5), 395–406. [doi:10.1002/ejsp.2420180503]
VAN ZALK, M. H. W., Kerr, M., VAN Zalk, N., & Stattin, H. (2013). Xenophobia and tolerance toward immigrants in adolescence: Cross-influence processes within friendships. Journal of Abnormal Child Psychology, 41, 627–639. [doi:10.1007/s10802-012-9694-8]
WEISBUCH, G., Deffuant, G., Amblard, F., & Nadal, J.-P. (2002). Meet, discuss, and segregate! Complexity, 7(3), 55–63. [doi:10.1002/cplx.10031]
WHITTAKER, J. O. (1963). Opinion change as a function of communication-Attitude discrepancy. Psychological Reports, 13(3), 763–772. [doi:10.2466/pr0.1963.13.3.763]
WÖLFER, R., & Hewstone, M. (2017). Beyond the dyadic perspective: 10 reasons for using social network analysis in intergroup contact research. British Journal of Social Psychology, 56(3), 609–617.
ZIMBARDO, P. G. (1960). Involvement and communication discrepancy as determinants of opinion conformity. The Journal of Abnormal and Social Psychology, 60(1), 86–94. [doi:10.1037/h0040786]
ZINGORA, T., H., S. T., & Flache, A. (2020). Who is most influential? Adolescents’ intergroup attitudes and peer influence within a social network. Group Processes & Intergroup Relations, 23(5), 684–709. [doi:10.1177/1368430219869460]