Behavioral Dynamics of Epidemic Trajectories and Vaccination Strategies: A Simulation-Based Analysis

,
and
aHarvard T.H. Chan School of Public Health, United States; bHarvard Medical School, United States; cSloan School of Management, Massachusetts Institute of Technology, United States; dGrado Department of Industrial and Systems Engineering, Virginia Tech, United States
Journal of Artificial
Societies and Social Simulation 28 (1) 3
<https://www.jasss.org/28/1/3.html>
DOI: 10.18564/jasss.5583
Received: 02-Jul-2024 Accepted: 20-Dec-2024 Published: 31-Jan-2025
Abstract
Human behavior shapes epidemic trajectories, evolving as individuals reassess risks over time. Our study closes the loop between epidemic status, individual risk assessments, and interactions. We developed an agent-based model where the individuals can alter their decisions based on perceived risks. In our model, agents’ perceived risk is proxied by their full awareness of actual risks, such as the probability of infection or death. We conducted several simulations of COVID-19 spread for a large metropolitan city akin to New York City, covering the period from December 2020 to May 2021. Our model allows residents to decide daily on traveling to crowded city areas or stay in neighborhoods with relatively lower population density. Our base run simulations indicate that when individuals assess their own risk and understand how diseases spread, they adopt behaviors that slow the spread of virus, leading to fewer cumulative cases and deaths but extending the duration of the outbreak. This model was then simulated with various vaccination strategies such as random distribution, prioritizing older individuals, high-contact-rate individuals, or crowded area residents, all within a risk-response behavioral framework. Results show that, in the presence of agents’ behavioral response, there is only a marginal difference across different vaccination strategies. Specifically, vaccination in crowded areas slightly outperformed other vaccination strategies in reducing infections and prioritizing the elderly was slightly more effective in decreasing deaths. The lack of a universally superior vaccination strategy comes from the fact that lowering a risk leads to more risky behavior which partly compensates for vaccination effects. The comparable outcomes of random versus targeted vaccinations highlight the importance of equitable distribution as another key focus in pandemic responses.Introduction
The COVID-19 pandemic has resulted in significant global mortality. As of June 2024, there have been approximately 800 million reported cases and around 7 million deaths worldwide (World Health Organization 2024). Vaccination emerged as a pivotal strategy in controlling the spread of the virus and mitigating its impacts. The administration of the COVID-19 vaccines in late 2020 was estimated to have prevented approximately 20 million deaths globally in the first year (Watson et al. 2022).
Despite variations in vaccine administration guidelines by region, there is a common approach to prioritizing individuals based on their risk levels. Typically, the highest priority groups include older adults, individuals with significant comorbidities, individuals with immunocompromising conditions, and frontline health workers (World Health Organization 2022). The constrained initial vaccine supply sparked a global discussion on prioritizing high-risk groups to maximize the pandemic’s burden reduction (Lipsitch & Dean 2020). This is particularly pertinent in densely populated urban environments like New York City, which have been severely affected by the pandemic, where identifying an effective vaccine distribution strategy that incorporates individuals’ responses to risk remains crucial yet insufficiently addressed.
Various studies have examined optimal vaccination strategies, yet ongoing debate persists regarding the most effective approach to prioritize vaccinations. Several studies, often employing age-stratified compartmental models, suggest prioritizing older adults (Moore et al. 2021), specifically those over 60 (Bubar et al. 2021), due to their diminished immunity and increased vulnerability to infection. Conversely, some individual-level models advocate for prioritizing vaccinations among superspreaders – those with high rates of contact with others – or based on social network metrics to mitigate transmission (Manzo & van de Rijt 2020; Vermeulen et al. 2021).
One area of improvement in model-based examination of vaccination policies is to incorporate change in human behavior through the course of pandemic. Most current models treat change in human behavior as an external factor without accounting for the nuanced evolution of individuals’ risk responses during a pandemic (Cuevas 2020; Kerr et al. 2021; Manzo & van de Rijt 2020; Shamil et al. 2021; Silva et al. 2020; Vermeulen et al. 2021). In other words, the simulated individuals do not alter their decisions endogenously (i.e., within the model) based on changes in perceived risks (Bruch & Atwell 2015). However, the combined estimation of both behavioral and disease parameters is essential in these epidemic models (Osi & Ghaffarzadegan 2024), given the simulation outcomes are sensitive to whether human responses to risk are endogenously modeled, reflecting the diverse ways individuals actually react to diseases in real-life (Mao 2014; Martinez-Moyano & Macal 2013).
Our overall goal in this study is to examine pandemic trajectories in the presence of behavioral responses, and the implications for vaccination strategies. Our study, conceptually, follows some recent models that incorporated human behavioral responses, mainly demonstrating a reduction in contact rates in response to increasing number of cases (LeJeune et al. 2024; Rahmandad 2022). However, such models are typically compartmental, utilizing differential equations to simulate dynamic interactions within the population (Andrade et al. 2024; Rahmandad et al. 2021). To account for stochasticity and capture the detailed heterogeneous attributes among individuals, our study extends prior research by introducing an agent-based model (ABM) that not only considers general behavioral responses but also focuses on the heterogeneity of individual risk perceptions and their evolution throughout a pandemic. This approach is particularly tailored to the complex social and demographic fabric of a major urban center – New York City. Our model is calibrated using specific data on New York City’s population structure and pandemic dynamics, providing a tailored analysis that offers more insights for urban public health strategies. Moreover, by investigating multiple vaccination strategies – ranging from random distribution to targeted approaches prioritizing vulnerable groups such as older adults and those with high contact rates in crowded urban areas, our model provides a critical evaluation of strategy effectiveness in real-time, addressing gaps left by broader models which do not account for local demographic variables and detailed epidemic progression timelines.
The first purpose of our study is to evaluate the impact of integrating behavioral response into epidemic control models, specifically examining how incorporating risk perception influences outcomes such as peak daily infection rates, total infections, and overall mortality. The second purpose is to compare which vaccination prioritization strategies within the risk perception framework most effectively mitigate these epidemic outcomes. The third purpose tests the feasibility and comparative effectiveness of random vaccination in crowded areas versus prioritizing individuals with high average daily contacts, especially given the challenges associated with obtaining accurate individual-level contact data (Nunner et al. 2022). This research is especially relevant for understanding vaccine rollout strategies during the initial stages of distribution.
Method
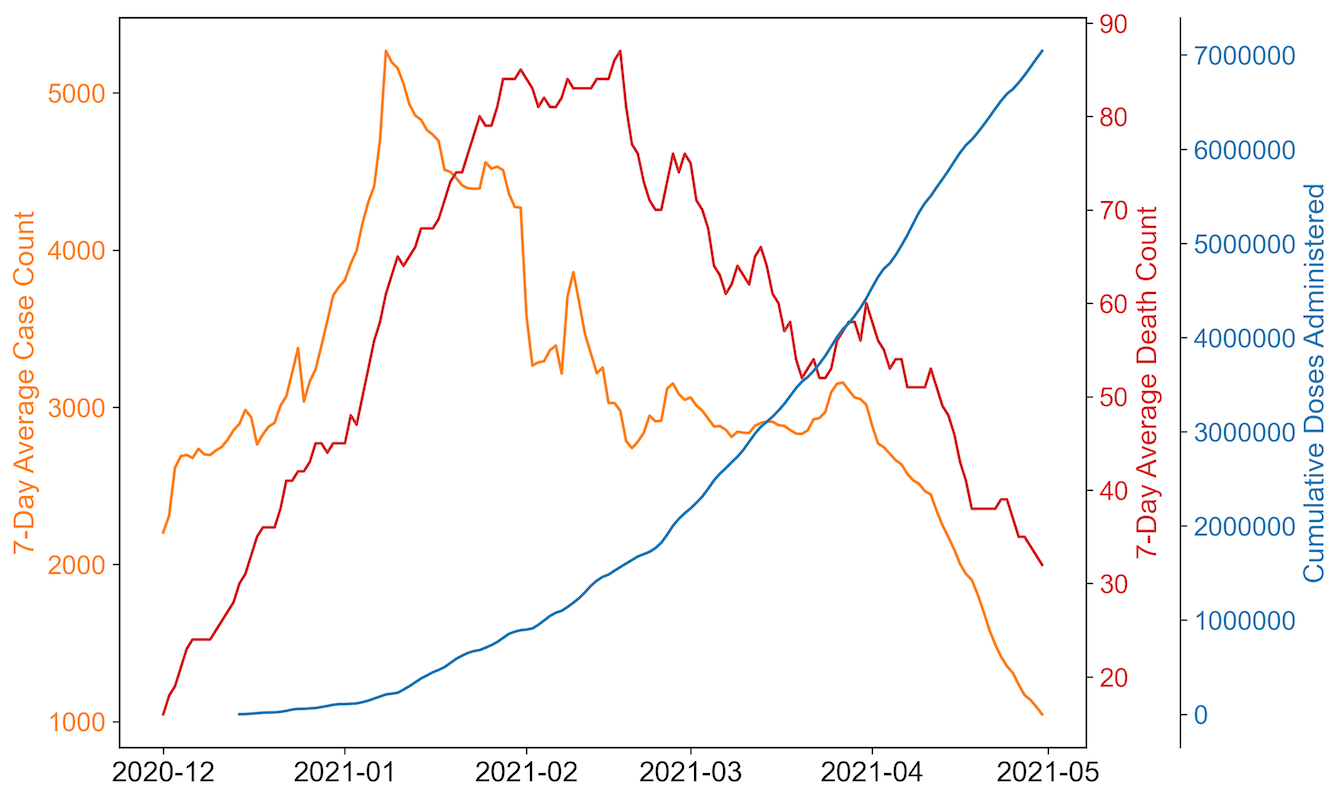
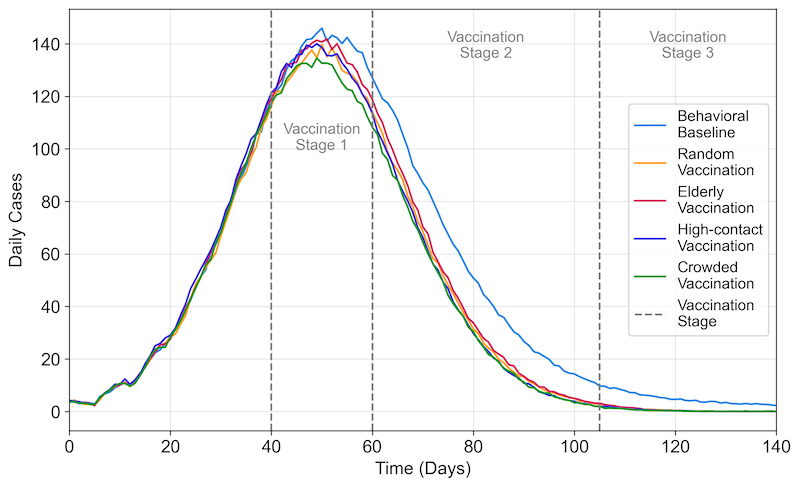
We develop an agent-based model tailored for epidemic trajectory and vaccination strategies of New York City. Known for its high population density and as a major global epicenter of the COVID-19 pandemic, New York City serves as an ideal archetype of populated urban areas for this study. The model is specifically designed to simulate the pandemic’s progression from early December 2020, identified as the start of the city’s second pandemic wave, until the end of April 2021, which marks the end of the wave (Figure 1). Vaccines in this model start becoming available by early January 2021, aligning with the vaccine allocation timeline in the city. Detailed information on the vaccination timeline used in this study can be found in a later section. Given that the agents in the model do not experience waning immunity from vaccination or infection and the model does not allow for reinfection, it might capture a shorter wave than observed in real scenarios. To streamline the simulation geographically, the model features a central area representing crowded areas in New York City, characterized by high population density and serving as a center for daily activities. The remaining portions of the city map depict areas with lower population density within the city.
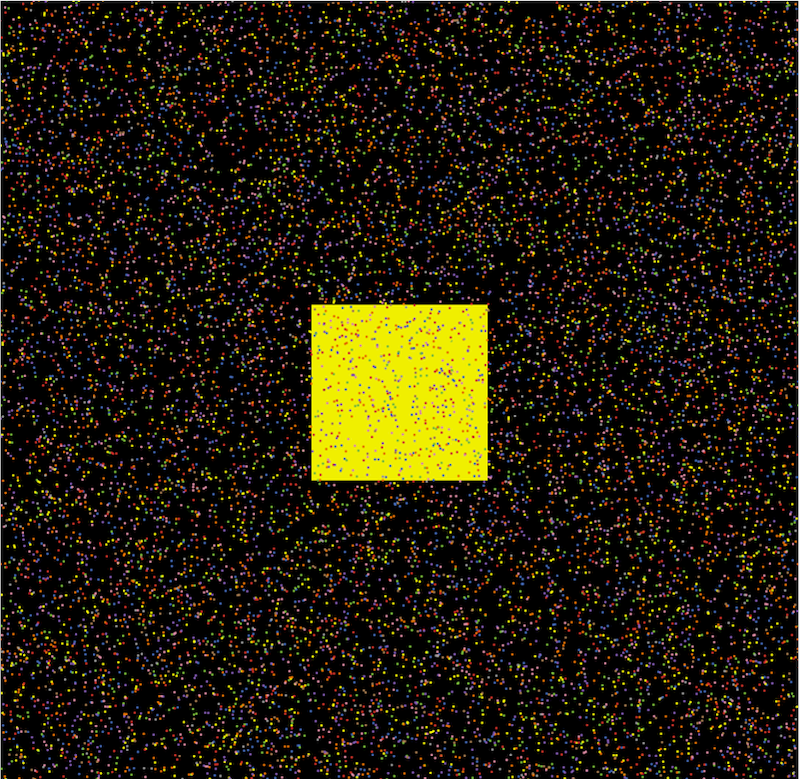
Figure 2 presents an example map of the model, where the central yellow block represents the crowded regions of New York City, symbolizing high population density and serving as a hub for daily activities. The surrounding areas illustrate less densely populated regions, with different colored dots indicating individuals from various age groups. This high-level abstraction consolidates all high-density areas into a single, centralized zone.
We simulate 6 scenarios and categorize them into 3 major categories: 1) a baseline model absent vaccinations, wherein residents exhibit no risk perception and remain unresponsive to change in disease prevalence; 2) a modified baseline model, without vaccinations, but incorporating residents’ risk assessment reflective of their individual characteristics and the pandemic’s severity; and 3) an extension of the baseline model that integrates 4 vaccination strategies alongside residents who are responsive to risk. All scenarios and descriptions are shown in Table 1. Each scenario was repeated 100 times, and the duration of the pandemic, peak daily cases, as well as cumulative infection and death counts were compared across scenarios. Due to the non-normal distribution of the data, Mann-Whitney U tests were employed for comparisons, which are suitable for non-parametric analysis.
The ABMs are developed using NetLogo (Wilensky 1999), inspired by the epiDEM Travel and Control model by Yang & Wilensky (2011)
| Scenario | Description | Endogenous Human Risk Response | Vaccination Strategy |
|---|---|---|---|
| 1 | Baseline | Fixed contact rate | None |
| 2 | Behavioral Baseline | Agents react to changing risks | None |
| 3 | Random Vaccination | Agents react to changing risks | Limited random vaccination |
| 4 | Elderly Vaccination | Agents react to changing risks | Limited random vaccination among elderly followed by general public |
| 5 | High-Contact Vaccination | Agents react to changing risks | Limited vaccination from high to low contact number |
| 6 | Crowded Vaccination | Agents react to changing risks | Limited random vaccination in crowded area followed by low-density area |
Baseline model
Agent
Each simulation employed 10,000 agents across a map of 58 by 59 patches to match the weighted average of 6.5 contacts per person (Feehan & Mahmud 2021). This contact rate arises from the population density within the grid, where agents interact with neighbors in their own patch and adjacent patches, simulating real-world social mixing patterns. The population characteristics were specifically calibrated to mirror those of New York City. This calibration included aligning the proportion of agents within each age group and modeling variations in infection probability and mortality given infection across these groups (New York City Department of Health and Mental Hygiene 2024b; United States Census Bureau 2024). Model parameter values are reported in Table 2.
Virus
We focused on the Iota and Alpha variants as representative strains, given their prevalence as the dominant circulating variants in New York City during the simulation period (Annavajhala et al. 2021). Consequently, the basic reproduction number (\(R_0\)) employed in our study was set at 3.0 (Davies et al. 2021; Petersen et al. 2020), and the average infection probability was derived by dividing \(R_0\) by the product of the infectious period and the average number of contacts at the onset of each simulation. Owing to the inherent stochastic nature of the ABMs, there existed a degree of variability in the distribution of agents within each simulation. This variability, though slight, led to minor differences in the infection probability across simulations.
SEIRDV Framework
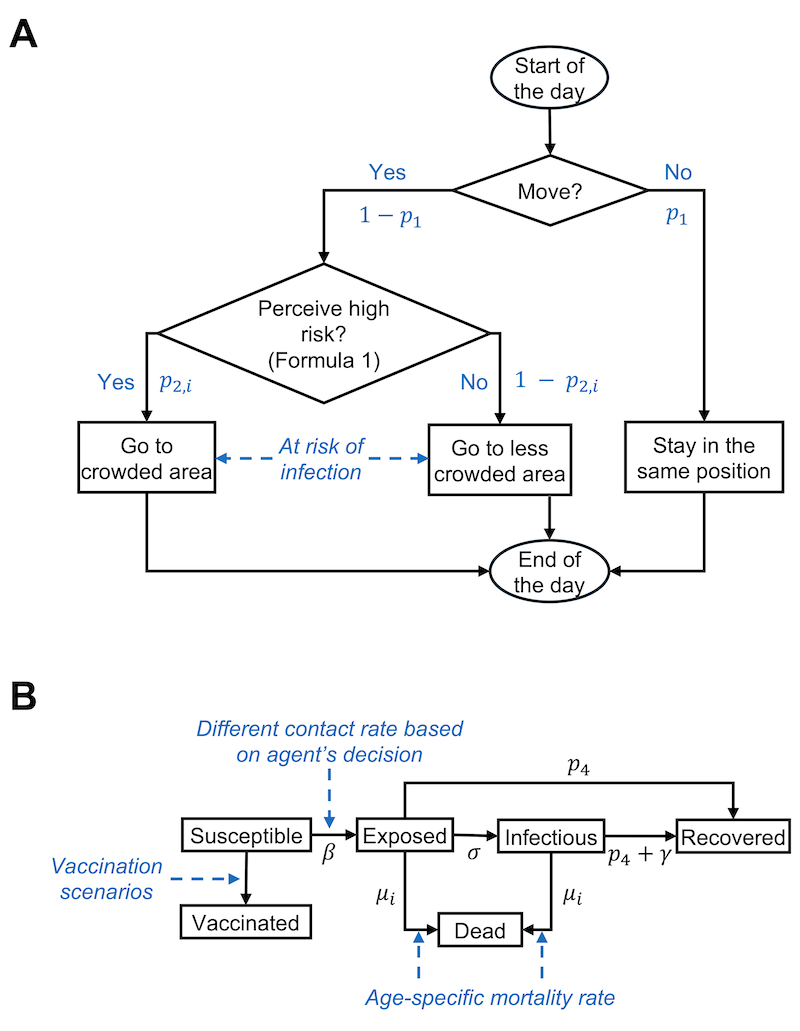
The schematic representation of the agent-based model with decision pathways, behavioral dynamics, and health status transition of an agent on each day can be found in Figure 3. Within each simulation scenario, agents can transition through six distinct, non-overlapping health statuses: susceptible, exposed, infectious, recovered from infection, dead, and vaccinated (SEIRDV). At the beginning of the simulation, 0.05% of the agents were designated as infectious, mirroring the actual proportion of initial infection cases in New York City (New York City Department of Health and Mental Hygiene 2024a), thereby facilitating the onset of the pandemic wave. The rest of the agents were categorized as susceptible. We acknowledge that in a real-world scenario, some individuals may have recovered from prior exposures and gained a certain level of resistance. However, due to the complexity and uncertainty in estimating the exact numbers and the degree of resistance of such individuals, they were not included in this initial categorization. This simplification and its implications are further discussed in the later section. Upon infection, an agent transitions into the exposed stage, undergoing a latent period of 5 days (Wu et al. 2022), followed by a subsequent infectious phase lasting an additional 7 days (Kahn et al. 2022). Post this period, the agent is considered to have recovered from the infection. During the exposed and infectious stages, agents may either recover early or recover at the normal rate, or die, outcomes determined by the agent’s individual recovery probability and susceptibility to mortality. It is assumed that in all simulations, agents once recovered from an infection would acquire complete immunity against reinfection for the remainder of the simulation. Additionally, the simulations operate on a closed population model without the introduction of new susceptible agents and death can only be attributed to infection.
Mixing Mechanism
Within each simulation, agents make daily decisions about visiting the crowded area based on their individual gathering tendencies. To quantify the shift in population gathering patterns pre- and during the pandemic, the gathering tendency for each age group was determined by calculating the ratio of the average number of contacts during the pandemic to the pre-pandemic average for each specific age group, obtained from Feehan & Mahmud (2021).
Agents move randomly within the simulation map, stepping into adjacent blocks either within crowded zone or the lower density region at every time step. Any agents located within the same or adjacent blocks—eight surrounding patches—are considered to have a one-time contact with each other during that time step. After each time step, agents in the crowded area have a 50 percent chance of either remaining crowded or relocating to a random location outside the crowded area. This probability is chosen to balance the complexity of modeling diverse motivations for staying in or leaving crowded places with the need for computational simplicity. It reflects a simplified assumption to take account of the variability in human behavior in environments like schools and offices, where patterns for stay and presence vary. In addition, agents have the option to stay-in-place at the beginning of each time step; by remaining stationary throughout its duration, they are effectively protected from both acquiring and spreading the infection to other agents.
| Parameter | Description | Value | Reference |
|---|---|---|---|
| Population size | Number of agents in the simulation | 10,000 | Feehan & Mahmud (2021) |
| Age structure | Proportion of agents by age group, with each agent randomly assigned an integer age within their group |
|
United States Census Bureau (2024) |
| Vaccination stage | The three vaccination stages by start date and daily vaccination rate |
|
Governor of New York (2021a,b,c), New York City Department of Health and Mental Hygiene (2024a) |
| \(p_1\) | Probability of stay-in-place | \(p_{1} \sim N(0.05, (0.0125)^2)\)\(1_{[0,0.1]}(p_{1})\) | Defined empirically |
| \(p_{2,i}\) |
Probability of going to the crowded area (gathering tendency)
|
|
Feehan & Mahmud (2021) |
| \(p_{3}\) | Probability of leaving the crowded area | 0.5 | Defined empirically |
| \(p_{4}\) | Probability of early recovery | 0.05 | Defined empirically |
| \(R_{0}\) | Basic reproduction number | 3.0 | Davies et al. (2021), Petersen et al. (2020) |
| \(\beta\) | Infection risk per contact | \(r_{i} \times \frac{R_{0}}{(l \times c)}\) | |
| \(r_{i}\) | Relative infection risk
|
|
Roy et al. (2022) |
| \(c\) | Average contact number | 6.5 | Feehan & Mahmud (2021) |
| Contact number | Contact number by age group
|
|
Feehan & Mahmud (2021) |
| \(\sigma\) | Rate from exposed to infectious | \(1 / t_{latent}\) | |
| \(\gamma\) | Rate of normal recovery to inoculated | \(1 / t_{infectious}\) | |
| \(t_{latent}\) | Latent period | 5 | Wu et al. (2022) |
| \(t_{infectious}\) | Infectious period | 7 | Kahn et al. (2022) |
| \(\mu_{i}\) | Mortality rate
|
|
New York City Department of Health and Mental Hygiene (2024a) |
| \(\eta\) | Risk perception threshold | 0.005 | Defined empirically |
| \(\epsilon_{i}\) | Personality effect
|
|
Czeisler et al. (2020) |
Modified baseline model with risk response
While the modified model largely retained the structure of the baseline model, it additionally integrated agents’ risk perception, influencing their decision to gather in crowded areas during each time step. This integration aims to more accurately capture the nuanced behaviors observed during outbreaks, reflecting how individuals assess risks based on a combination of personal and environmental factors (Attema et al. 2021; Cusack 2021; Mertens et al. 2020).
To emulate real-life decision-making and risk assessment behavior, the model’s dynamic risk response mechanism considered several interconnected factors. The current infection case prevalence (\(prevalence(t)\)), representing the observable risk level within the community, and the average number of contacts per agent in the crowded area (\(contact_{crowded}(t)\)), quantifying potential exposure, are environmental risk experienced by individuals at each time step (Yıldırım et al. 2021). These are complemented by individual factors, including infection probability (\(\beta\)) and age stratified death vulnerability upon infection (\(\mu_{i}\)), which tailor the risk assessment to personal susceptibilities (Dryhurst et al. 2020; Stangier et al. 2022).
Additionally, psychological factors further enriched this model – specifically, the risk perception threshold (\(\eta\)) and risk tolerance personality (\(\epsilon_{i}\)). Each agent was assigned a risk tolerance personality (\(\epsilon_{i}\)), derived from a survey querying attitudes towards stay-at-home orders and nonessential business closures (Czeisler et al. 2020). Agents were categorized as either policy supporters or non-supporters, mirroring the distribution observed in the survey responses. This risk tolerance trait may override other parameters in determining an agent’s gathering decision. For instance, policy-supporting agents with low vulnerability to death and infection may still exhibit a high likelihood of avoiding gatherings in crowded areas, indicating that personality traits significantly influence decisions regarding preventive behaviors (Kassas et al. 2021; Teran-Escobar et al. 2021). The risk perception threshold, detailed in Table 2 is empirically defined and adjustable within the model for the manual testing of different levels of risk responsiveness. While these parameters account for individual and environmental factors influencing agents’ decisions, they are based on the assumption that agents have full awareness of the actual risks (objective probabilities of death and exposure). In our model, these objective probabilities, combined with environmental and psychological profiles, serve as a proxy for behavior influenced by subjective risk perception. This threshold, along with the risk tolerance personality derived from the survey data, influences how agents respond to the risks posed by their environment and their personal health profiles.
The ensemble of these factors summarizes the decision-making process by individuals as follows:
| \[ prevalence(t) \times contact_{crowded}(t) \times \beta \times \mu_{i} < \eta + \epsilon_{i}\] | \[(1)\] |
This inequality determines an agent’s daily decision on whether to gather in areas considered to be high-risk based on their personalized assessment of the risk, which is influenced by both external environmental pressures and their own psychological tendencies.
Vaccination model
Vaccination scenarios
To replicate real-life vaccination scenarios in New York City during the second wave of the pandemic, the modified baseline model incorporating risk response was employed, integrating four distinct vaccination policies: 1) random vaccination of agents throughout the map; 2) focused vaccination of elderly individuals aged 65 and over; 3) vaccination of agents prioritized from those with higher to lower contact numbers; and 4) random vaccination of agents who gather in crowded areas, serving as a more realistic and feasible alternative to the high-contact-number strategy. In our analysis, vaccines are modeled on an all-or-nothing basis, where we assume individuals will immediately become fully immune after receiving vaccines. This simplification is necessitated by the intricate dynamics of immune responses (Forni & Mantovani 2021), the diversity among vaccine manufacturers (Collier et al. 2021), the varied timelines for immunity development (Ainsua-Enrich et al. 2022), and factors such as age, which influence immune response progression post-vaccination (Wang et al. 2021), further complicating the accuracy of modeling. Each agent is eligible for only one vaccine dose, and only susceptible agents qualify for vaccination.
Vaccination timeline
In each simulation, vaccine distribution scenarios were created to reflect the vaccination timeline and quantities consistent with those observed in New York City. The simulation features three distinct vaccination stages, each representing significant milestones in the availability of a limited number of vaccines. The initial stage, lasting 20 days, corresponds to the onset of vaccine allocation in mid-January to early February (Governor of New York 2021a), marked by the most severe vaccine shortage. Here, the daily vaccination rate is 0.2%, exclusively targeting a specific policy-identified population. The subsequent stage extends for 45 days, reflecting the first major increase in vaccine availability from early February to mid-March (Governor of New York 2021b). In this phase, the daily vaccination rate increases to 0.4%, half to the policy-targeted group and half to the general population. The final stage, continuing until the simulation’s end, represents a further easing of vaccine limitations post-April (Governor of New York 2021c), with daily vaccination rate being 0.7% at random to all eligible recipients. In instances where the entire policy-targeted population is vaccinated on a particular day, surplus vaccines are then randomly distributed to other eligible members of the population.
Sensitivity analysis
For the sensitivity analysis, we utilized one-at-a-time (OAT) analyses to assess the impact of various parameters on the outcomes of different scenarios, measured as percentage differences relative to the original parameter settings. This approach helped determine if the direction of changes was as expected and evaluated the robustness of our model in relation to vaccination scenarios selection based on measured outcome metrics. To balance the comprehensiveness of the analysis with the time required to run the simulations, we repeated each scenario 50 times and reduced the population size to 30% of the original, which corresponds to 3,000 individuals. We also proportionately scaled down the map size to maintain the average 6.5 contacts per individual. The OAT analyses explored changes in variables such as vaccination timelines, probability of leaving crowded areas (\(p_{3}\)), basic reproduction number (\(R_{0}\)), and risk perception threshold (\(\eta\)). Notably, changes in vaccination timelines were tested only in vaccination scenarios, while adjustments to risk perception thresholds were tested in all scenarios with behavioral response. Detailed descriptions of these parameter adjustments are documented in Table 3.
Results
The simulation results revealed differences in average outbreak duration, peak daily cases, time to peak, cumulative infections, and cumulative deaths across all scenarios (Table 4 and Figures 4, 5, 6). Incorporating risk perception significantly altered these outcome metrics compared to the baseline. While statistical tests indicated significant differences in specific metrics among the vaccination scenarios (Table 5), the practical significance of these differences may be limited due to their marginal numerical values. Detailed descriptions of these outcome metrics across scenarios are provided in the following sections.
Peak daily cases
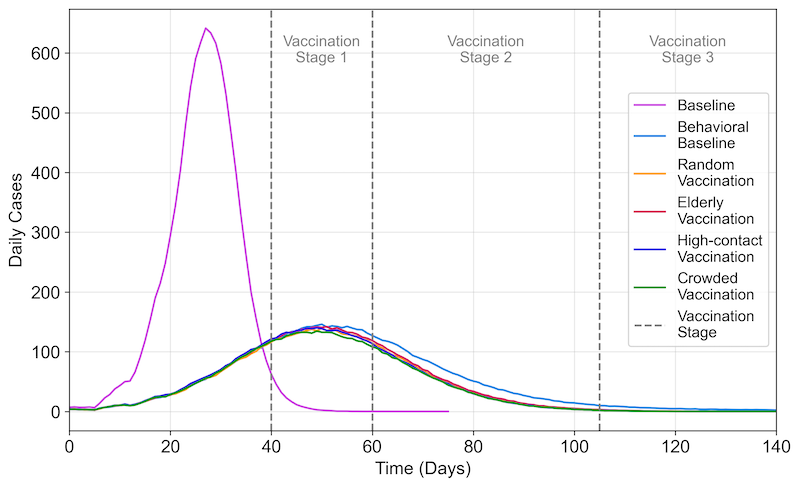
Without vaccination or risk perception interventions, the baseline scenario yielded the highest average peak daily cases at 695.20 (\(SD = 34.28\)), with the quickest onset to peak occurring at 27.65 days (\(SD = 1.93\)). Introducing risk perception interventions created a difference of over 70% in peak daily cases and nearly doubled the time to reach the outbreak’s peak compared to the baseline scenario (Figures 4 and 5). The vaccination strategy that prioritized individuals in crowded areas produced the lowest average peak daily cases of 155.26 (\(SD = 19.45\)), statistically significantly lower than the strategy prioritizing elderly vaccination, which resulted in 163.21 cases (\(SD = 18.63\), adjusted \(p = .004\)). The average time to reach the peak daily case was similar across all vaccination scenarios.
Cumulative infections
The baseline scenario’s average cumulative number of infections was 9,874.53 (\(SD = 18.80\)), and the application of risk perception in response to the progression of the outbreak led to an approximately 30% lower number of infections of 7,056.89 (\(SD = 254.96\)). Vaccination strategies in addition to the risk perception made a difference of over 10% in the average cumulative number of infections, with similar outcomes among them. The vaccination of individuals in crowded area resulted in the lowest average cases at 5,767.84 (\(SD = 423.19\)), significantly lower than all other scenarios (adjusted \(p <.001\)). Additionally, prioritizing the elderly for vaccination led to a statistically significantly higher average of cumulative infection cases, at 6,123.78 (\(SD = 368.29\)), compared to all other vaccination approaches (all adjusted \(p <.001\)). It is worth to note that the average cumulative infections yielded between random vaccination and prioritizing high-contact individuals has no statistically significant difference (adjusted \(p = .478\)), as shown in Figure 6.
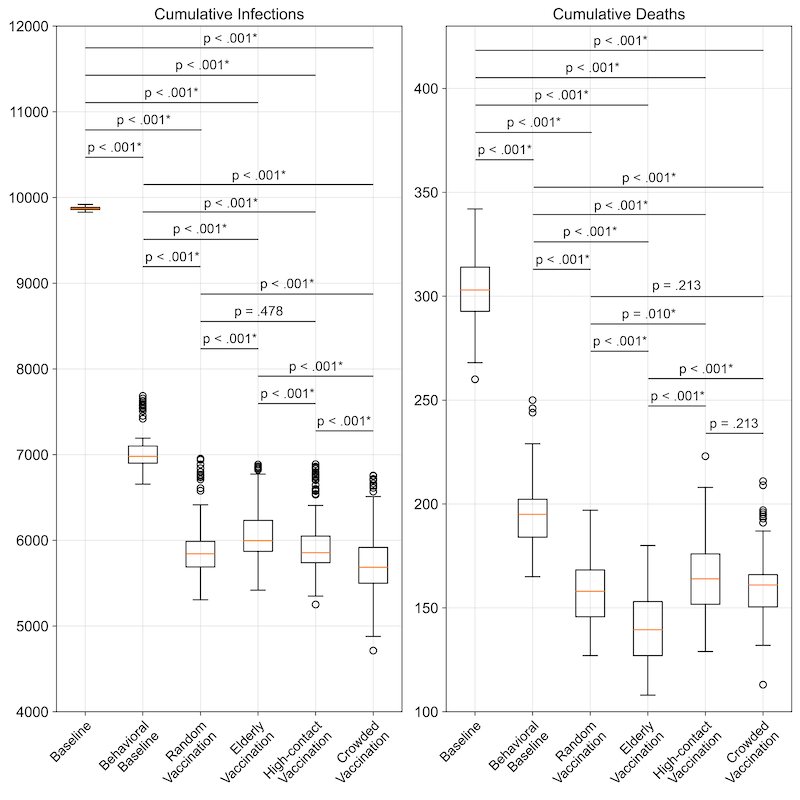
Cumulative deaths
Integrating behavioral responses into the baseline model led to a significant difference in average cumulative deaths by over 35%, baseline and behavioral baseline yielded 304.14 (\(SD = 17.00\)) and 195.35 (\(SD = 16.72\)), respectively. Among the vaccination strategies, prioritizing the elderly achieved nearly 30% lower in cumulative deaths (139.92; \(SD = 17.33\)) compared to the behavioral baseline without vaccination, marking the lowest average cumulative deaths and statistically significant compared to all other vaccination scenarios (adjusted \(p < .001\)). However, no significant differences were observed in average cumulative deaths between the scenario prioritizing vaccination of individuals in crowded areas and random vaccination or prioritizing vaccination for high-contact individuals (both adjusted \(p = .213\)).
Wave duration
Across all scenarios examined, the baseline scenario exhibited the quickest outbreak spread, with an average duration of 65.39 days (\(SD = 3.87\)) and integrating risk perception without vaccination significantly slowed the virus’s spread, extending the average wave duration to 245.75 days (\(SD = 58.79\)). The introduction of various vaccination strategies yielded similar average durations across four distinct scenarios, ranging from 125.95 to 127.79 days (Figure 5), with no significant differences observed between them.
Sensitivity Analysis
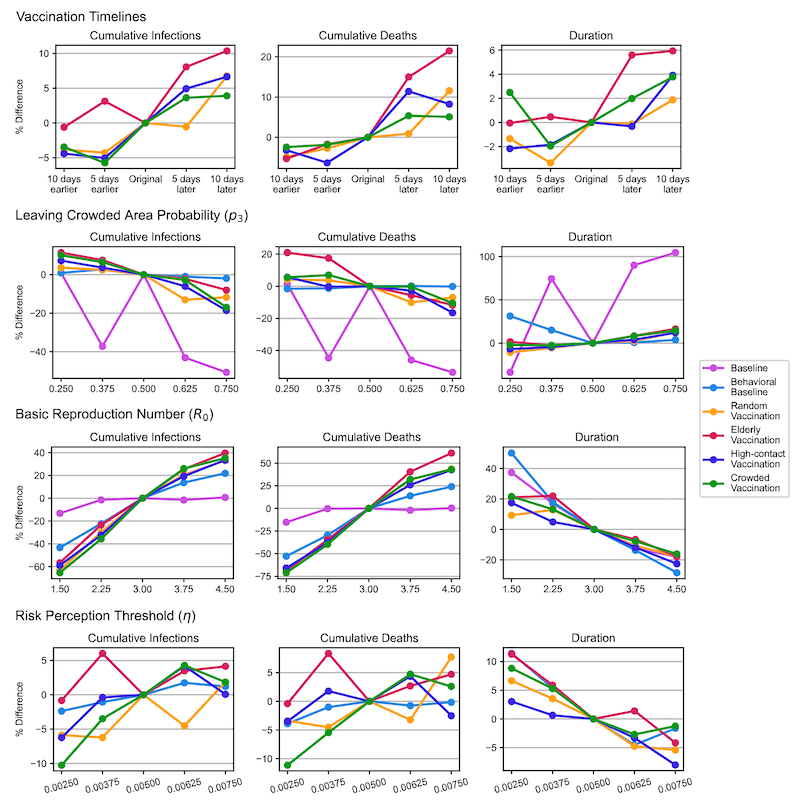
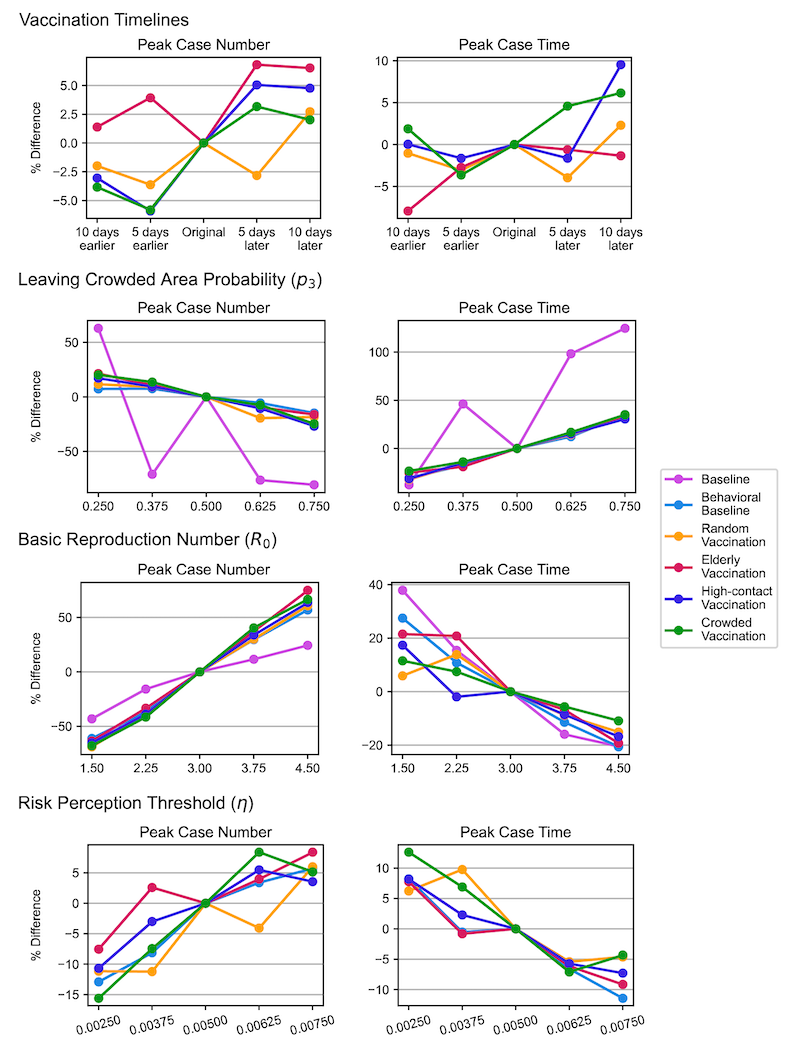
Figure 7 presents line plots illustrating the percentage changes in outcome metrics under various scenarios due to parameter adjustments, with the expected trends confirming the model’s robustness. To improve readability, we have included representative outcome plots (cumulative infections, cumulative deaths, and outbreak duration) in the main content, while the remaining plots (peak case numbers and time to peak) have been moved to the appendix as Figure 8.
The top row of Figure 7 shows the impact of different vaccination start days on model outcomes. Earlier vaccination generally reduces the number of infections, deaths, and the duration of the outbreak by accelerating the acquisition of immunity in the population. This process effectively reduces the susceptible pool and limits the overall spread of the virus. The second row illustrates the effect of varying the likelihood of individuals leaving crowded areas. A higher likelihood of avoiding crowded areas reduces infections and deaths. However, this behavior also extends the outbreak duration, as more susceptible individuals remain uninfected for longer periods. While the infection rate is lowered, the persistence of a larger susceptible population results in a prolonged outbreak.
The third row examines the impact of different values of R0 values increase cumulative infections and deaths but shorten the outbreak duration. This occurs because higher \(R_{0}\) amplifies the infection rate per contact, leading to a faster spread through the population and a quicker depletion of the susceptible pool. Finally, the bottom row evaluates the influence of varying the risk perception threshold. Higher thresholds, which reduce individuals’ responsiveness to perceived outbreak risks, accelerate virus transmission. This results in higher cumulative infections and deaths, as individuals are less likely to adopt preventive actions in response to the outbreak.
Table 6 shows that the primary outcomes – cumulative infections and deaths—exhibit only marginal differences across vaccination scenarios, consistent with the primary analysis. Regardless of parameter variations, prioritizing older individuals for vaccination consistently results in the fewest cumulative deaths, while targeting vaccinations in crowded areas effectively minimizes cumulative infections. These results underscore the simulation’s ability to reliably predict primary outcomes across all scenarios.
Discussion
This study dynamically captures nuanced changes in individual behaviors in response to evolving pandemic risks, specifically focusing on COVID-19’s unique transmission dynamics and societal impacts using ABM. The model is calibrated using real-world urban population characteristics, vaccination coverage proportions, and timelines for vaccine distribution during periods of vaccine shortages. After testing the impact of incorporating risk perception into the model, we further use the model to evaluate the effectiveness of various vaccination strategies. We analyze changes in the impact of vaccinations on preventing infections and deaths, as well as shifts in optimal vaccination policies, once the model accounts for humans’ dynamic responses to risks.
This study has several findings. First, the model incorporating risk response behavior showed a different outbreak burden compared to the model without such behavior. Notably, peak daily cases were around 70% lower in the model with risk response behavior, and the virus spread over a longer period. This was characterized by a doubling of the time required to reach the peak number of daily cases and an extension of the overall duration of the wave. Furthermore, the model predicted 28.5% fewer cumulative infections and 35.8% fewer deaths, respectively, when risk response behavior was included. This evidence demonstrates the impact of incorporating risk-perceiving behavior in simulating and managing pandemic dynamics, further emphasizing the value of endogenous variables alongside medical and public health measures in ABMs (Souther et al. 2023). However, it is important to acknowledge that the validity of findings from this study hinges on the accuracy with which human behavior is modeled. Modeling human decision-making presents significant challenges due to its complex and dynamic nature. The assumptions about risk-perceiving behavior in this study are inherently simplified representations of real-world actions. This simplification can influence the model’s outcomes, meaning the interpretation of our results is largely contingent upon the behavioral assumptions made.
Second, the study explored a pragmatic vaccination strategy that aimed at immunizing the population with higher daily contact numbers. Given the logistical challenges in identifying and reaching individuals with high average daily contacts (Feehan & Mahmud 2021; Pooley et al. 2022), particularly due to geographic dispersion (Fisk 2021), prioritizing vaccinations for individuals in crowded region was examined as a more feasible alternative to vaccinating high-contact individuals. This approach resulted in an outbreak progression pattern comparable to that of high-contact individual vaccination in terms of epidemic curve, duration, time to peak daily cases, and cumulative deaths. However, vaccinating individuals in crowded areas slightly surpassed the high-contact prioritization strategy with lower average cumulative cases of infection. This finding substantiates the practicality and efficacy of targeting crowded areas for vaccination as an effective alternative to the direct vaccination of high-contact individuals.
Third, among the evaluated vaccination strategies, those targeting individuals with high contact rates and those in crowded areas were slightly more effective in yielding lower cumulative infections by the end of the simulations. Notably, despite the effectiveness of high-contact individual vaccination, it showed no statistically significant difference in cumulative infection cases compared to random vaccination. In addition, the comparatively lesser efficacy of vaccinating high-contact individuals than vaccinating crowded areas can be attributed to the rapid vaccination of those most likely to transmit the virus, leading to a swift depletion of high-contact individuals susceptible to infection. Moreover, the prevalence of superspreading events in crowded areas underscores the effectiveness of vaccinating these populations (Althouse et al. 2020). Individuals in densely populated areas, particularly less responsive to public health measures, elevate the risk of superspreading events. Vaccination in these areas directly mitigates this risk, as superspreading events can substantially increase transmission, affecting individuals regardless of their contact numbers. Consequently, prioritizing vaccinations in crowded areas not only targets a critical point of viral transmission but also contributes to the overall reduction of cumulative infections by preventing potential superspreading occurrences and providing indirect protections in the community. This strategic focus on crowded areas for vaccination efforts is thus instrumental in controlling the pandemic’s spread.
Lastly, the strategy of prioritizing vaccinations for the elderly resulted in the lowest cumulative deaths among all vaccination scenarios. However, this approach also led to the highest cumulative infections compared to other vaccination policies. The elderly population’s heightened vulnerability to severe outcomes from COVID-19 underscores the importance of protecting this demographic to save lives (Chen et al. 2021). Nonetheless, their relatively lower average daily contact rates, particularly during the pandemic (Oliveira et al. 2022), suggest a limited role in the virus’s transmission dynamics compared to more mobile and socially active population segments. This discrepancy between reduced mortality and increased cumulative infections may be attributed to the strategy’s focus on preventing severe disease outcomes rather than interrupting transmission chains. While vaccinating the elderly is crucial for reducing healthcare burdens and saving lives, it does not necessarily address the broader community transmission. This highlights a critical consideration in pandemic response strategies: the balance between targeting vaccinations to prevent deaths and focusing on interrupting transmission to reduce overall infection rates. It highlights the need for a multifaceted vaccination approach that not only protects the most vulnerable but also considers the dynamics of virus spread within the general population. Additionally, vaccinations in crowded areas show no significant statistical difference from high-contact and random strategies regarding cumulative deaths. This equivalence supports the effectiveness of both targeted and random vaccination approaches as viable alternatives.
Another important finding of this analysis is that although variations exist in the cumulative infection and death counts across diverse vaccination strategies, these differences are generally marginal. This phenomenon could be attributed to the moderating effect of the population’s risk response behavior on the outcomes of different vaccination policies, particularly in the short term and during rapid pandemic growth. However, this hypothesis necessitates further exploration through additional investigations and simulations to be validated. Moreover, the exponential increase in vaccine availability following the initial months of the rollout may further contribute to the nuanced differences observed between vaccination strategies due to the rapid immunity accumulation. This observation leads to crucial questions regarding the prioritization of vaccination efforts. If the differences in outcomes between vaccination strategies are minimal, the focus may shift towards ensuring equitable distribution of vaccines. Without equitable access, health disparities could be further exacerbated (Jean-Jacques & Bauchner 2021). Achieving similar vaccine coverage in all regions would align study results more closely with real-life scenarios, highlighting the importance of protecting all population segments, especially those at higher risk or with less access to healthcare resources.
Limitations and future directions
This study, while providing valuable insights into pandemic management through agent-based modeling, is subject to several limitations. First, the model calibration using New York City data relies on publicly available, largely estimated datasets. This reliance may not fully capture the detailed outbreak progression or accurately represent contact matrices across different age groups. Despite these constraints, the overall findings remain qualitatively robust, supported by a comprehensive sensitivity analysis.
Second, our model operates under a set of assumptions that may limit its real-world applicability. All non-infectious agents are categorized as susceptible during initialization, excluding individuals who may have gained partial immunity from previous exposures. This simplification overlooks certain dynamics of herd immunity and disease resistance. The model also assumes perfect immunity post-vaccination or recovery and does not account for vaccine hesitancy or potential viral mutations, which could influence the effectiveness of public health interventions. Additionally, the model assumes that agents are fully aware of the actual risks (objective probabilities of death and exposure), using this objective awareness as a proxy for subjective risk perception. While this assumption simplifies the modeling process, it does not account for how individuals may misinterpret or respond differently to risk due to incomplete information and personal biases.
Third, the model’s treatment of spatial heterogeneity and human mobility is simplified. The assumption that agents decide to remain in or exit crowded locations with a fixed 50% probability does not fully capture the spectrum of human decision-making influenced by personal and contextual factors. This reduction in complexity may affect the model’s ability to mimic real-world interactions and mobility patterns accurately.
Future research should aim to address the identified limitations and expand the model’s applicability and accuracy. To better capture the epidemiological nuances, subsequent research could integrate a full range of immunity level based on past infections and vaccination histories. This enhancement would refine the predictive accuracy and depth of disease modeling, making it more reflective of real-world conditions. Exploring the impact of demographic and geographic variations on pandemic management strategies also presents a promising avenue for future work. Research could investigate how different population densities or age structures influence the effectiveness of public health strategies. For example, modeling strategies in cities with varying age demographics or in rural versus urban settings could provide insights into tailored pandemic responses. Additionally, extending the model to other phases of the pandemic or to other infectious diseases with different parameters, such as influenza, could further validate its utility. Incorporating Geographic Information Systems (GIS) to simulate more realistic human mobility patterns and virus transmission in metropolitan settings could enhance the model’s predictive capabilities, as demonstrated in recent studies (Goenka et al. 2024; Karic et al. 2024). Such advancements would not only improve the model’s accuracy but also broaden its applicability to global public health challenges.
Conclusion
This study employed an agent-based model to elucidate the interplay between epidemic status, individual risk assessments, and interactions. The simulation results highlight the significance of representing individual behavioral responses in pandemic modeling. While our approach simplifies real-world behaviors, it demonstrates how such representations can significantly influence the effectiveness of different vaccination strategies. Our findings indicate that the choice of vaccination strategy should align with specific desired outcomes: prioritizing vaccinations for individuals in crowded areas minimizes both cumulative infection cases and peak daily cases, whereas prioritizing the elderly reduces cumulative deaths. While no single vaccination strategy outperforms all others across every metric, and most of the variations are marginal, both targeted strategies and random vaccination have yielded commendable and comparable results. Therefore, when targeted vaccination strategies require significant resources, such as identifying high-contact individuals, random vaccination emerges as a practical alternative. This further highlights the importance of equitable vaccine distribution in real-world settings, as suggested by the model’s outcomes. Ensuring access for high-risk groups or those with limited healthcare access reinforces the need for inclusivity in public health strategies.
Model Documentation
The model code, ODD (Overview, Design concepts, and Details) protocol, and instructions for running the code are available for download from the Computational Model Library of CoMSES at: https://doi.org/10.25937/7pjw-7358.Acknowledgements
We are thankful to Ross Williams and Sami Nour for helping with implementing the simulation experiments. This research is funded by the US National Science Foundation, Division of Mathematical Sciences and Division of Social and Economic Sciences, Award 2229819.Author Contributions
- Concept and design: Ghaffarzadegan.
- Acquisition, analysis, or interpretation of data: All authors.
- Drafting of the manuscript: Zhang.
- Critical revision of the manuscript for important intellectual content: All authors.
- Statistical analysis: Zhang.
- Visualization: Zhang.
- Administrative, technical, or material support: Jalali, Ghaffarzadegan.
Appendix
| Parameter | Description | Value | Reference |
|---|---|---|---|
| Population size | Number of agents in the simulation | 3,000 (originally 10,000) | Defined empirically |
| \(R_{0}\) | Basic reproduction number | 1.50, 2.25, 3.75, 4.50 (originally 3.0) | Defined empirically |
| \(p_{3}\) | Probability of leaving the crowded area | 0.250, 0.375, 0.625, 0.750 (originally 0.500) | Defined empirically |
| \(\eta\) | Risk perception threshold | 0.00250, 0.00375, 0.00625, 0.00750 (originally 0.00500) | Defined empirically |
| Accelerated vaccination plan | The accelerated three vaccination stages by start date and daily vaccination rate | 10 and 5 days earlier and later | Defined empirically |
| No Vaccination | Vaccination with Risk Perception | |||||
|---|---|---|---|---|---|---|
| Without Risk Perception | With Risk Perception | Random Vaccination | Elderly-Prioritizing Vaccination | High-Contact-Prioritizing Vaccination | Crowded-Prioritizing Vaccination | |
| Average Wave Duration | ||||||
| Mean (SD) | 65.39 (3.87) | 245.75 (58.79) | 127.79 (7.80) | 127.45 (6.53) | 127.09 (7.85) | 125.95 (7.85) |
| Interquartile range | 62.75-68.00 | 204.00-281.00 | 123.00-133.00 | 123.00-133.00 | 122.75-132.00 | 121.00-130.00 |
| Full range | 57.00-75.00 | 135.00-403.00 | 105.00-147.00 | 111.00-141.00 | 105.00-149.00 | 103.00-150.00 |
| Average Peak Case | ||||||
| Mean (SD) | 695.20 (34.28) | 166.74 (16.74) | 159.69 (17.36) | 163.21 (18.63) | 161.07 (19.02) | 155.26 (19.45) |
| Interquartile range | 665.75-712.00 | 154.75-176.25 | 149.75-163.00 | 150.00-175.50 | 148.75-170.00 | 143.00-164.00 |
| Full range | 641.00-772.00 | 142.00-207.00 | 130.00-210.00 | 129.00-206.00 | 132.00-216.00 | 118.00-211.00 |
| Average Peak Case Time | ||||||
| Mean (SD) | 27.65 (1.93) | 50.62 (5.26) | 49.98 (5.03) | 49.78 (4.51) | 48.49 (4.65) | 48.54 (4.39) |
| Interquartile range | 27.00-29.00 | 47.00-54.00 | 47.00-52.00 | 47.00-53.00 | 45.00-51.25 | 45.00-51.00 |
| Full range | 22.00-32.00 | 39.00-66.00 | 38.00-64.00 | 41.00-64.00 | 38.00-62.00 | 40.00-60.00 |
| Average Cumulative Infections | ||||||
| Mean (SD) | 9874.53 (18.80) | 7056.89 (254.96) | 5923.98 (369.54) | 6123.78 (368.29) | 5974.62 (398.34) | 5767.84 (423.19) |
| Interquartile range | 9860.75-9884.25 | 6900.00-7100.00 | 5690.25-5989.00 | 5871.75-6233.50 | 5739.00-6049.25 | 5500.50-5918.00 |
| Full range | 9829.00-9919.00 | 6656.00-7685.00 | 5307.00-6954.00 | 5419.00-6885.00 | 5251.00-6889.00 | 4714.00-6756.00 |
| Average Cumulative Deaths | ||||||
| Mean (SD) | 304.14 (17.00) | 195.35 (16.72) | 157.76 (16.77) | 139.92 (17.33) | 165.87 (18.60) | 161.55 (17.50) |
| Interquartile range | 292.75-314.00 | 184.00-202.25 | 145.75-168.25 | 127.00-153.00 | 151.75-176.00 | 150.50-166.00 |
| Full range | 260.00-342.00 | 165.00-250.00 | 127.00-197.00 | 108.00-180.00 | 129.00-223.00 | 113.00-211.00 |
| Outcome Metric | Policy 1 | Policy 2 | U-Statistic | p value | adjusted p value |
|---|---|---|---|---|---|
| Average wave duration | Crowded | High-Contact | 4369.5 | .123 | .493 |
| Crowded | Baseline | 10000.0 | \(<.001\) | \(<.001\) | |
| Crowded | Behavioral Baseline | 15.5 | \(<\).001 | \(<\).001 | |
| Crowded | Elderly | 4248.0 | .066 | .330 | |
| Crowded | Random | 4129.5 | .033 | .200 | |
| High-Contact | Baseline | 10000.0 | \(<\).001 | \(<\).001 | |
| High-Contact | Behavioral Baseline | 13.0 | \(<\).001 | \(<\).001 | |
| High-Contact | Elderly | 4898.0 | .804 | 1.000 | |
| High-Contact | Random | 4726.0 | .504 | 1.000 | |
| Baseline | Behavioral Baseline | 0.0 | \(<\).001 | \(<\).001 | |
| Baseline | Elderly | 0.0 | \(<\).001 | \(<\).001 | |
| Baseline | Random | 0.0 | \(<\).001 | \(<\).001 | |
| Behavioral Baseline | Elderly | 9986.0 | \(<\).001 | \(<\).001 | |
| Behavioral Baseline | Random | 9980.5 | \(<\).001 | \(<\).001 | |
| Elderly | Random | 4785.0 | .600 | 1.000 | |
| Average Peak Case | Crowded | High-Contact | 3964.0 | .011 | .067 |
| Crowded | Baseline | 0.0 | \(<\).001 | \(<\).001 | |
| Crowded | Behavioral Baseline | 2907.5 | \(<\).001 | \(<\).001 | |
| Crowded | Elderly | 3572.0 | .000 | .004 | |
| Crowded | Random | 3962.0 | .011 | .067 | |
| High-Contact | Baseline | 0.0 | \(<\).001 | \(<\).001 | |
| High-Contact | Behavioral Baseline | 3719.0 | .002 | .012 | |
| High-Contact | Elderly | 4550.5 | .272 | .817 | |
| High-Contact | Random | 4984.5 | .971 | .971 | |
| Baseline | Behavioral Baseline | 10000.0 | \(<\).001 | \(<\).001 | |
| Baseline | Elderly | 10000.0 | \(<\).001 | \(<\).001 | |
| Baseline | Random | 10000.0 | \(<\).001 | \(<\).001 | |
| Behavioral Baseline | Elderly | 5847.0 | .039 | .154 | |
| Behavioral Baseline | Random | 6429.0 | \(<\).001 | .004 | |
| Elderly | Random | 5441.5 | .281 | .817 | |
| Average Peak Case Time | Crowded | High-Contact | 4975.5 | .953 | 1.000 |
| Crowded | Baseline | 0.0 | \(<\).001 | \(<\).001 | |
| Crowded | Behavioral Baseline | 6217.5 | .003 | .027 | |
| Crowded | Elderly | 5757.5 | .064 | .380 | |
| Crowded | Random | 5786.0 | .054 | .380 | |
| High-Contact | Baseline | 0.0 | \(<\).001 | \(<\).001 | |
| High-Contact | Behavioral Baseline | 6224.5 | .003 | .027 | |
| High-Contact | Elderly | 5779.5 | .056 | .380 | |
| High-Contact | Random | 5845.0 | .039 | .309 | |
| Baseline | Behavioral Baseline | 0.0 | \(<\).001 | \(<\).001 | |
| Baseline | Elderly | 0.0 | \(<\).001 | \(<\).001 | |
| Baseline | Random | 0.0 | \(<\).001 | \(<\).001 | |
| Behavioral Baseline | Elderly | 5530.5 | .194 | .777 | |
| Behavioral Baseline | Random | 5448.5 | .272 | .817 | |
| Elderly | Random | 5087.0 | .832 | 1.000 | |
| Average Cumulative Infection | Crowded | High-Contact | 3184.5 | \(<\).001 | \(<\).001 |
| Crowded | Baseline | 0.0 | \(<\).001 | \(<\).001 | |
| Crowded | Behavioral Baseline | 6.0 | \(<\).001 | \(<\).001 | |
| Crowded | Elderly | 2121.0 | \(<\).001 | \(<\).001 | |
| Crowded | Random | 3447.0 | \(<\).001 | \(<\).001 | |
| High-Contact | Baseline | 0.0 | \(<\).001 | \(<\).001 | |
| High-Contact | Behavioral Baseline | 90.5 | \(<\).001 | \(<\).001 | |
| High-Contact | Elderly | 3413.5 | \(<\).001 | \(<\).001 | |
| High-Contact | Random | 5291.0 | .478 | .478 | |
| Baseline | Behavioral Baseline | 10000.0 | \(<\).001 | \(<\).001 | |
| Baseline | Elderly | 10000.0 | \(<\).001 | \(<\).001 | |
| Baseline | Random | 10000.0 | \(<\).001 | \(<\).001 | |
| Behavioral Baseline | Elderly | 9890.0 | \(<\).001 | \(<\).001 | |
| Behavioral Baseline | Random | 9871.5 | \(<\).001 | \(<\).001 | |
| Elderly | Random | 6915.5 | \(<\).001 | \(<\).001 | |
| Average Cumulative Death | Crowded | High-Contact | 4351.5 | .113 | .213 |
| Crowded | Baseline | 0.0 | \(<\).001 | \(<\).001 | |
| Crowded | Behavioral Baseline | 792.5 | \(<\).001 | \(<\).001 | |
| Crowded | Elderly | 8075.0 | \(<\).001 | \(<\).001 | |
| Crowded | Random | 5661.0 | .106 | .213 | |
| High-Contact | Baseline | 0.0 | \(<\).001 | \(<\).001 | |
| High-Contact | Behavioral Baseline | 1199.0 | \(<\).001 | \(<\).001 | |
| High-Contact | Elderly | 8427.0 | \(<\).001 | \(<\).001 | |
| High-Contact | Random | 6202.5 | .003 | .010 | |
| Baseline | Behavioral Baseline | 10000.0 | \(<\).001 | \(<\).001 | |
| Baseline | Elderly | 10000.0 | \(<\).001 | \(<\).001 | |
| Baseline | Random | 10000.0 | \(<\).001 | \(<\).001 | |
| Behavioral Baseline | Elderly | 9952.0 | \(<\).001 | \(<\).001 | |
| Behavioral Baseline | Random | 9471.5 | \(<\).001 | \(<\).001 | |
| Elderly | Random | 2390.0 | \(<\).001 | \(<\).001 | |
| No Vaccination | Vaccination with Risk Perception | |||||
|---|---|---|---|---|---|---|
| Without Risk Perception | With Risk Perception | Random Vaccination | Elderly-Prioritizing Vaccination | High-Contact-Prioritizing Vaccination | Crowded-Prioritizing Vaccination | |
| Vaccination Timelines | ||||||
| Cumulative Infections, Mean (SD) | ||||||
| 10 days earlier | N/A | N/A | 1753.80 (201.41) | 1758.94 (298.47) | 1713.36 (154.44) | 1675.02 (163.76) |
| 5 days earlier | N/A | N/A | 1745.60 (381.39) | 1825.14 (295.13) | 1701.90 (308.75) | 1635.40 (458.26) |
| Original | N/A | N/A | 1823.58 (308.32) | 1769.80 (465.61) | 1792.26 (288.42) | 1734.86 (401.20) |
| 5 days later | N/A | N/A | 1813.60 (401.16) | 1912.72 (299.80) | 1880.76 (304.19) | 1797.92 (396.66) |
| 10 days later | N/A | N/A | 1946.84 (301.04) | 1953.28 (302.85) | 1911.40 (220.22) | 1802.64 (423.31) |
| Cumulative Deaths, Mean (SD) | ||||||
| 10 days earlier | N/A | N/A | 45.48 (8.56) | 37.38 (10.20) | 48.74 (8.54) | 47.32 (7.22) |
| 5 days earlier | N/A | N/A | 46.52 (12.11) | 38.80 (9.20) | 47.16 (11.05) | 47.60 (15.26) |
| Original | N/A | N/A | 47.82 (10.83) | 39.48 (12.23) | 50.36 (10.38) | 48.50 (13.08) |
| 5 days later | N/A | N/A | 48.24 (12.66) | 45.40 (10.84) | 56.10 (11.80) | 51.10 (13.35) |
| 10 days later | N/A | N/A | 53.36 (10.40) | 47.96 (11.87) | 54.50 (10.45) | 50.96 (14.29) |
| Leaving Crowded Area Probability (\(p_{3}\)) | ||||||
| Cumulative Infections, Mean (SD) | ||||||
| 0.250 | 2984.90 (3.35) | 2165.56 (450.49) | 1888.96 (487.45) | 1971.58 (132.54) | 1922.22 (308.75) | 1909.78 (163.37) |
| 0.375 | 1857.14 (304.98) | 2204.98 (325.42) | 1868.36 (404.46) | 1903.02 (404.07) | 1857.14 (304.98) | 1847.12 (327.58) |
| 0.500 (Original) | 2958.62 (8.36) | 2146.22 (324.93) | 1823.58 (308.32) | 1769.80 (465.61) | 1792.26 (288.42) | 1734.86 (401.20) |
| 0.625 | 1683.30 (298.95) | 2125.16 (319.17) | 1585.42 (441.00) | 1730.60 (281.29) | 1683.30 (298.95) | 1686.96 (303.21) |
| 0.750 | 1458.72 (347.44) | 2104.42 (325.84) | 1608.94 (221.62) | 1627.80 (203.09) | 1458.72 (347.44) | 1441.08 (371.28) |
| Cumulative Deaths, Mean (SD) | ||||||
| 0.250 | 91.82 (8.16) | 60.60 (14.87) | 49.80 (14.53) | 47.74 (9.78) | 53.20 (11.53) | 51.18 (8.59) |
| 0.375 | 50.20 (10.88) | 60.78 (11.02) | 49.60 (13.12) | 46.36 (12.18) | 50.20 (10.88) | 51.88 (11.67) |
| 0.500 (Original) | 90.62 (9.41) | 61.56 (11.82) | 47.82 (10.83) | 39.48 (12.23) | 50.36 (10.38) | 48.50 (13.08) |
| 0.625 | 48.98 (11.29) | 61.68 (11.31) | 43.00 (14.73) | 37.26 (9.61) | 48.98 (11.29) | 48.34 (10.55) |
| 0.750 | 42.04 (11.62) | 61.46 (11.76) | 44.46 (9.08) | 34.84 (9.19) | 42.04 (11.62) | 43.40 (13.84) |
| Basic Reproduction Number (\(R_{0}\)) | ||||||
| Cumulative Infections, Mean (SD) | ||||||
| 1.50 | 2566.04 (759.61) | 1215.44 (438.62) | 669.12 (361.18) | 766.64 (345.62) | 735.20 (329.41) | 600.54 (272.66) |
| 2.25 | 2916.74 (12.38) | 1667.32 (431.93) | 1278.16 (291.29) | 1354.74 (172.67) | 1212.66 (442.27) | 1115.44 (328.27) |
| 3.00 (Original) | 2958.62 (8.36) | 2146.22 (324.93) | 1823.58 (308.32) | 1769.80 (465.61) | 1792.26 (288.42) | 1734.86 (401.20) |
| 3.75 | 2913.72 (416.28) | 2439.36 (50.05) | 2199.90 (92.00) | 2222.02 (95.99) | 2138.22 (317.10) | 2187.22 (101.15) |
| 4.50 | 2978.66 (4.00) | 2614.18 (50.45) | 2425.64 (79.77) | 2472.06 (67.25) | 2392.00 (347.58) | 2347.62 (348.43) |
| Cumulative Deaths, Mean (SD) | ||||||
| 1.50 | 76.78 (23.78) | 29.08 (11.80) | 13.98 (8.51) | 12.46 (6.72) | 17.22 (8.52) | 14.06 (6.83) |
| 2.25 | 90.32 (7.46) | 43.36 (12.94) | 31.28 (9.04) | 25.80 (8.30) | 31.30 (12.48) | 29.26 (10.58) |
| 3.00 (Original) | 90.62 (9.41) | 61.56 (11.82) | 47.82 (10.83) | 39.48 (12.23) | 50.36 (10.38) | 48.50 (13.08) |
| 3.75 | 88.84 (15.68) | 70.14 (7.09) | 62.98 (8.01) | 55.48 (8.95) | 63.44 (11.50) | 64.08 (8.38) |
| 4.50 | 90.96 (8.38) | 76.38 (8.63) | 68.62 (7.84) | 63.64 (7.91) | 71.78 (12.60) | 69.42 (13.87) |
| Risk Perception Threshold (\(\eta\)) | ||||||
| Cumulative Infections, Mean (SD) | ||||||
| 0.00250 | N/A | 2095.30 (313.71) | 1716.16 (180.65) | 1755.04 (177.14) | 1680.36 (305.01) | 1556.98 (405.47) |
| 0.00375 | N/A | 2123.58 (318.98) | 1710.12 (328.00) | 1876.38 (154.77) | 1785.20 (350.67) | 1674.30 (306.45) |
| 0.00500 (Original) | N/A | 2146.22 (324.93) | 1823.58 (308.32) | 1769.80 (465.61) | 1792.26 (288.42) | 1734.86 (401.20) |
| 0.00625 | N/A | 2183.62 (324.25) | 1741.12 (472.03) | 1831.46 (401.47) | 1867.18 (301.15) | 1809.04 (403.65) |
| 0.00750 | N/A | 2172.16 (325.43) | 1857.48 (407.11) | 1843.16 (491.77) | 1793.36 (471.34) | 1766.66 (406.61) |
| Cumulative Deaths, Mean (SD) | ||||||
| 0.00250 | N/A | 59.16 (11.52) | 46.20 (8.43) | 39.32 (8.20) | 48.60 (10.45) | 43.10 (12.45) |
| 0.00375 | N/A | 60.94 (11.89) | 45.66 (11.41) | 42.78 (9.35) | 51.26 (13.81) | 45.86 (10.15) |
| 0.00500 (Original) | N/A | 61.56 (11.82) | 47.82 (10.83) | 39.48 (12.23) | 50.36 (10.38) | 48.50 (13.08) |
| 0.00625 | N/A | 61.10 (11.88) | 46.28 (13.90) | 40.54 (11.63) | 52.56 (10.72) | 50.80 (12.50) |
| 0.00750 | N/A | 61.46 (11.92) | 51.52 (13.80) | 41.34 (12.86) | 49.10 (14.86) | 49.76 (12.95) |
References
AINSUA-ENRICH, E., Pedreño-Lopez, N., Bracke, C., Ávila-Nieto, C., Rodríguez De La Concepción, M. L., Pradenas, E., Trinité, B., Marfil, S., Miranda, C., González, S., Toledo, R., Font, M., Benet, S., Escribà, T., Jimenez-Moyano, E., Peña, R., Cedeño, S., Prado, J. G., Mothe, B., … Carrillo, J. (2022). Kinetics of immune responses elicited after three mRNA COVID-19 vaccine doses in predominantly antibody-deficient individuals. iScience, 25(11), 105455. [doi:10.1016/j.isci.2022.105455]
ALTHOUSE, B. M., Wenger, E. A., Miller, J. C., Scarpino, S. V., Allard, A., Hébert-Dufresne, L., & Hu, H. (2020). Superspreading events in the transmission dynamics of SARS-CoV-2: Opportunities for interventions and control. PLoS Biology, 18(11), e3000897. [doi:10.1371/journal.pbio.3000897]
ANDRADE, J., Beishuizen, B., Stein, M., Connolly, M., & Duggan, J. (2024). Preparing for pandemic response in the context of limited resources. System Dynamics Review, 40(3), e1775. [doi:10.1002/sdr.1775]
ATTEMA, A. E., L’Haridon, O., Raude, J., Seror, V., & The COCONEL Group. (2021). Beliefs and risk perceptions about COVID-19: Evidence from two successive French representative surveys during lockdown. Frontiers in Psychology, 12, 619145. [doi:10.3389/fpsyg.2021.619145]
BRUCH, E., & Atwell, J. (2015). Agent-based models in empirical social research. Sociological Methods & Research, 44(2), 186–221. [doi:10.1177/0049124113506405]
BUBAR, K. M., Reinholt, K., Kissler, S. M., Lipsitch, M., Cobey, S., Grad, Y. H., & Larremore, D. B. (2021). Model-informed COVID-19 vaccine prioritization strategies by age and serostatus. Science, 371(6532), 916–921. [doi:10.1126/science.abe6959]
CHEN, Y., Klein, S. L., Garibaldi, B. T., Li, H., Wu, C., Osevala, N. M., Li, T., Margolick, J. B., Pawelec, G., & Leng, S. X. (2021). Aging in COVID-19: Vulnerability, immunity and intervention. Ageing Research Reviews, 65, 101205. [doi:10.1016/j.arr.2020.101205]
COLLIER, A. Y., Yu, J., McMahan, K., Liu, J., Chandrashekar, A., Maron, J. S., Atyeo, C., Martinez, D. R., Ansel, J. L., Aguayo, R., Rowe, M., Jacob-Dolan, C., Sellers, D., Barrett, J., Ahmad, K., Anioke, T., VanWyk, H., Gardner, S., Powers, O., … Barouch, D. H. (2021). Differential kinetics of immune responses elicited by Covid-19 vaccines. New England Journal of Medicine, 385(21), 2010–2012. [doi:10.1056/nejmc2115596]
CUEVAS, E. (2020). An agent-based model to evaluate the COVID-19 transmission risks in facilities. Computers in Biology and Medicine, 121, 103827. [doi:10.1016/j.compbiomed.2020.103827]
CUSACK, M. (2021). Individual, social, and environmental factors associated with active transportation commuting during the COVID-19 pandemic. Journal of Transport 1& Health, 22, 101089. [doi:10.1016/j.jth.2021.101089]
CZEISLER, M. É., Tynan, M. A., Howard, M. E., Honeycutt, S., Fulmer, E. B., Kidder, D. P., Robbins, R., Barger, L. K., Facer-Childs, E. R., Baldwin, G., Rajaratnam, S. M. W., & CZEISLER, C. A. (2020). Public attitudes, behaviors, and beliefs related to COVID-19, stay-at-Home orders, nonessential business closures, and public health guidance - United States, New York City, and Los Angeles, May 5–12, 2020. MMWR. Morbidity and Mortality Weekly Report, 69(24), 751–758. [doi:10.15585/mmwr.mm6924e1]
DAVIES, N. G., Abbott, S., Barnard, R. C., Jarvis, C. I., Kucharski, A. J., Munday, J. D., Pearson, C. A. B., Russell, T. W., Tully, D. C., Washburne, A. D., Wenseleers, T., Gimma, A., Waites, W., Wong, K. L. M., Van Zandvoort, K., Silverman, J. D., CMMID COVID-19 Working Group and COVID-19 Genomics UK (COG-UK) Consortium, Diaz-Ordaz, K., Keogh, R., … Edmunds, W. J. (2021). Estimated transmissibility and impact of SARS-CoV-2 lineage B.1.1.7 in England. Science, 372(6538), eabg3055. [doi:10.1126/science.abg3055]
DRYHURST, S., Schneider, C. R., Kerr, J., Freeman, A. L. J., Recchia, G., Van Der Bles, A. M., Spiegelhalter, D., & Van Der Linden, S. (2020). Risk perceptions of COVID-19 around the world. Journal of Risk Research, 23(7–8), 994–1006. [doi:10.1080/13669877.2020.1758193]
FEEHAN, D. M., & Mahmud, A. S. (2021). Quantifying population contact patterns in the United States during the COVID-19 pandemic. Nature Communications, 12(1), 893. [doi:10.1038/s41467-021-20990-2]
FISK, R. J. (2021). Barriers to vaccination for coronavirus disease 2019 (COVID-19) control: Experience from the United States. Global Health Journal, 5(1), 51–55. [doi:10.1016/j.glohj.2021.02.005]
FORNI, G., & Mantovani, A. (2021). COVID-19 vaccines: Where we stand and challenges ahead. Cell Death & Differentiation, 28(2), 626–639.
GOENKA, A., Zaslavsky, I., Jiaxi, L., Graham, R., & Aronoff-Spencer, E. (2024). Understanding LLMs’ capabilities to support spatially-disaggregated epidemiological simulations. Available at: https://doi.org/10.5281/ZENODO.13960333
GOVERNOR of New York. (2021a). Governor Cuomo announces list of comorbidities and underlying conditions eligible for COVID-19 vaccine starting February 15. Available at: https://www.governor.ny.gov/news/governor-cuomo-announces-list-comorbidities-and-underlying-conditions-eligible-covid-19-vaccine
GOVERNOR of New York. (2021b). Governor Cuomo announces New Yorkers 60 years of age and older and additional public facing essential workers will be eligible to receive COVID-19 vaccine. Available at: https://www.governor.ny.gov/news/governor-cuomo-announces-new-york-state-provide-new-separate-allocation-35000-covid-19
GOVERNOR of New York. (2021c). Governor Cuomo announces New York State to provide new separate allocation of 35,000 COVID-19 vaccines for college students. Available at: https://www.governor.ny.gov/news/governor-cuomo-announces-new-yorkers-60-years-age-and-older-and-additional-public-facing
JEAN-JACQUES, M., & Bauchner, H. (2021). Vaccine distribution - Equity left behind? JAMA, 325(9), 829. [doi:10.1001/jama.2021.1205]
KAHN, R., Schrag, S. J., Verani, J. R., & Lipsitch, M. (2022). Identifying and alleviating bias due to differential depletion of susceptible people in postmarketing evaluations of COVID-19 vaccines. American Journal of Epidemiology, 191(5), 800–811. [doi:10.1093/aje/kwac015]
KARIC, B., Stenkamp, J., Brüggemann, M., Schröder, S., Kray, C., & Verstegen, J. (2024). Collecting data in an immersive video environment to set up an agent-Based model of pedestrians’ compliance with COVID-Related interventions. Journal of Artificial Societies and Social Simulation, 27(2), 5. [doi:10.18564/jasss.5340]
KASSAS, B., Morgan, S. N., Lai, J. H., Kropp, J. D., & Gao, Z. (2021). Perception versus preference: The role of self-assessed risk measures on individual mitigation behaviors during the COVID-19 pandemic. PLoS One, 16(8), e0254756. [doi:10.1371/journal.pone.0254756]
KERR, C. C., Stuart, R. M., Mistry, D., Abeysuriya, R. G., Rosenfeld, K., Hart, G. R., Núñez, R. C., Cohen, J. A., Selvaraj, P., Hagedorn, B., George, L., Jastrzębski, M., Izzo, A. S., Fowler, G., Palmer, A., Delport, D., Scott, N., Kelly, S. L., Bennette, C. S., … Klein, D. J. (2021). Covasim: An agent-based model of COVID-19 dynamics and interventions. PLoS Computational Biology, 17(7), e1009149. [doi:10.1371/journal.pcbi.1009149]
LEJEUNE, L., Ghaffarzadegan, N., Childs, L. M., & Saucedo, O. (2024). Mathematical analysis of simple behavioral epidemic models. Mathematical Biosciences, 375, 109250. [doi:10.1016/j.mbs.2024.109250]
LIPSITCH, M., & Dean, N. E. (2020). Understanding COVID-19 vaccine efficacy. Science, 370(6518), 763–765. [doi:10.1126/science.abe5938]
MANZO, G., & van de Rijt, A. (2020). Halting SARS-CoV-2 by targeting high-Contact individuals. Journal of Artificial Societies and Social Simulation, 23(4), 10. [doi:10.18564/jasss.4435]
MAO, L. (2014). Modeling triple-diffusions of infectious diseases, information, and preventive behaviors through a metropolitan social network - An agent-based simulation. Applied Geography, 50, 31–39. [doi:10.1016/j.apgeog.2014.02.005]
MARTINEZ-MOYANO, I. J., & Macal, C. M. (2013). Exploring feedback and endogeneity in agent-based models. 2013 Winter Simulations Conference (WSC) [doi:10.1109/wsc.2013.6721546]
MERTENS, G., Gerritsen, L., Duijndam, S., Salemink, E., & Engelhard, I. M. (2020). Fear of the coronavirus (COVID-19): Predictors in an online study conducted in March 2020. Journal of Anxiety Disorders, 74, 102258. [doi:10.1016/j.janxdis.2020.102258]
MOORE, S., Hill, E. M., Dyson, L., Tildesley, M. J., & Keeling, M. J. (2021). Modelling optimal vaccination strategy for SARS-CoV-2 in the UK. PLoS Computational Biology, 17(5), e1008849. [doi:10.1371/journal.pcbi.1008849]
NEW York City Department of Health and Mental Hygiene. (2024a). About COVID-19 data - NYC health. Available at: https://www.nyc.gov/site/doh/covid/covid-19-data-about.page
NEW York City Department of Health and Mental Hygiene. (2024b). COVID-19: Latest data - NYC health. Available at: https://www.nyc.gov/site/doh/covid/covid-19-data.page
NUNNER, H., van De Rijt, A., & Buskens, V. (2022). Prioritizing high-contact occupations raises effectiveness of vaccination campaigns. Scientific Reports, 12(1), 737. [doi:10.1038/s41598-021-04428-9]
OLIVEIRA, M. R., Sudati, I. P., Konzen, V. D. M., De Campos, A. C., Wibelinger, L. M., Correa, C., Miguel, F. M., Silva, R. N., & Borghi-Silva, A. (2022). Covid-19 and the impact on the physical activity level of elderly people: A systematic review. Experimental Gerontology, 159, 111675. [doi:10.1016/j.exger.2021.111675]
OSI, A., & Ghaffarzadegan, N. (2024). Parameter estimation in behavioral epidemic models with endogenous societal risk-response. PLoS Computational Biology, 20(3), e1011992. [doi:10.1371/journal.pcbi.1011992]
PETERSEN, E., Koopmans, M., Go, U., Hamer, D. H., Petrosillo, N., Castelli, F., Storgaard, M., Al Khalili, S., & Simonsen, L. (2020). Comparing SARS-CoV-2 with SARS-CoV and influenza pandemics. The Lancet Infectious Diseases, 20(9), e238–e244. [doi:10.1016/s1473-3099(20)30484-9]
POOLEY, C. M., Doeschl-Wilson, A. B., & Marion, G. (2022). Estimation of age-stratified contact rates during the COVID-19 pandemic using a novel inference algorithm. Philosophical Transactions of the Royal Society A: Mathematical, Physical and Engineering Sciences, 380(2233), 20210298. [doi:10.1098/rsta.2021.0298]
RAHMANDAD, H. (2022). Behavioral responses to risk promote vaccinating high‐contact individuals first. System Dynamics Review, 38(3), 246–263. [doi:10.1002/sdr.1714]
RAHMANDAD, H., Lim, T. Y., & Sterman, J. (2021). Behavioral dynamics of COVID‐19: Estimating underreporting, multiple waves, and adherence fatigue across 92 nations. System Dynamics Review, 37(1), 5–31. [doi:10.1002/sdr.1673]
ROY, J., Heath, S. M.,Wang, S. & Ramkrishna, D. (2022). Modeling COVID-19 transmission between age groups in the United States considering virus mutations, vaccinations, and reinfection. Scientific Reports, 12(1), 20098 [doi:10.1038/s41598-022-21559-9]
SHAMIL, M. S., Farheen, F., Ibtehaz, N., Khan, I. M., & Rahman, M. S. (2021). An agent-Based modeling of COVID-19: Validation, analysis, and recommendations. Cognitive Computation, 1–12. [doi:10.1101/2020.07.05.20146977]
SILVA, P. C. L., Batista, P. V. C., Lima, H. S., Alves, M. A., Guimarães, F. G., & SILVA, R. C. P. (2020). COVID-ABS: An agent-based model of COVID-19 epidemic to simulate health and economic effects of social distancing interventions. Chaos, Solitons & Fractals, 139, 110088. [doi:10.1016/j.chaos.2020.110088]
SOUTHER, A., Chang, M. H., & Tassier, T. (2023). It’s worth a shot: Urban density, endogenous vaccination decisions, and dynamics of infectious disease. Journal of Economic Interaction and Coordination, 18(1), 163–189. [doi:10.1007/s11403-022-00367-4]
STANGIER, U., Kananian, S., & Schüller, J. (2022). Perceived vulnerability to disease, knowledge about COVID-19, and changes in preventive behavior during lockdown in a German convenience sample. Current Psychology, 41(10), 7362–7370. [doi:10.1007/s12144-021-01456-6]
TERAN-ESCOBAR, C., Forestier, C., Ginoux, C., Isoard-Gautheur, S., Sarrazin, P., Clavel, A., & Chalabaev, A. (2021). Individual, sociodemographic, and environmental factors related to physical activity during the spring 2020 COVID-19 lockdown. Frontiers in Psychology, 12, 643109. [doi:10.3389/fpsyg.2021.643109]
UNITED States Census Bureau. (2024). S0101: AGE AND SEX - Census bureau table. Available at: https://data.census.gov/table/ACSST5Y2021.S0101?q=population+by+single+year+age+and+sex+&g=160XX00US3651000
VERMEULEN, B., Müller, M., & Pyka, A. (2021). Social network metric-Based interventions? Experiments with an agent-Based model of the COVID-19 pandemic in a metropolitan region. Journal of Artificial Societies and Social Simulation, 24(3), 6. [doi:10.18564/jasss.4571]
WANG, J., Tong, Y., Li, D., Li, J., & Li, Y. (2021). The impact of age difference on the efficacy and safety of COVID-19 vaccines: A systematic review and meta-Analysis. Frontiers in Immunology, 12, 758294. [doi:10.3389/fimmu.2021.758294]
WATSON, O. J., Barnsley, G., Toor, J., Hogan, A. B., Winskill, P., & Ghani, A. C. (2022). Global impact of the first year of COVID-19 vaccination: A mathematical modelling study. The Lancet Infectious Diseases, 22(9), 1293–1302. [doi:10.1016/s1473-3099(22)00320-6]
WILENSKY, U. (1999). NetLogo. Available at: http://ccl.northwestern.edu/netlogo/
WORLD Health Organization. (2022). Global COVID-19 vaccination strategy in a changing world: July 2022 update. Available at: https://www.who.int/publications/m/item/global-covid-19-vaccination-strategy-in-a-changing-world--july-2022-update
WORLD Health Organization. (2024). COVID-19 cases - WHO COVID-19 dashboard. Available at: https://data.who.int/dashboards/covid19/cases
WU, Y., Kang, L., Guo, Z., Liu, J., Liu, M., & Liang, W. (2022). Incubation period of COVID-19 caused by unique SARS-CoV-2 strains: A systematic review and meta-analysis. JAMA Network Open, 5(8), e2228008. [doi:10.1001/jamanetworkopen.2022.28008]
YANG, C., & Wilensky, U. (2011). NetLogo epiDEM Travel and Control model. Available at: http://ccl.northwestern.edu/netlogo/models/epiDEMTravelandControl
YILDIRIM, M., Geçer, E., & Akgül, Ö. (2021). The impacts of vulnerability, perceived risk, and fear on preventive behaviours against COVID-19. Psychology, Health & Medicine, 26(1), 35–43.