Simulating Extinction and its Role in Food Reinforcement Learning for Ultra-Processed Foods

, ,
and
aWageningen University, Netherlands; bVrije Universiteit Amsterdam, Netherlands
Journal of Artificial
Societies and Social Simulation 29 (3) 3
<https://www.jasss.org/29/3/3.html>
DOI: 10.18564/jasss.6083
Received: 14-Jan-2025 Accepted: 18-May-2026 Published: 30-Jun-2026
Abstract
Food environments such as supermarkets and school cafeterias are increasingly dominated by ultra-processed foods (UPFs). Consumption of these foods is partly shaped by reinforcement learning, where repeated intake leads to expected rewards. In contrast, encountering foods without consuming them can weaken these expectations through extinction — a process missing in existing models simulating food reinforcement learning. As a result, current models may fail to predict changes in learning, particularly following interventions like dieting or changes in food availability. We integrated extinction into a model of food reinforcement learning, allowing agents to update reward expectations through both consumption and non-consumption. First, we examine the conditions under which extinction prevents agents from learning to favor UPFs over less processed foods (LPFs) in environments with varying UPF availability. Second, we test interventions after agents learn in food environments resembling American supermarkets by varying (1) dieting probability and UPF availability, and (2) UPF reward value and availability. In prevention scenarios, extinction led agents to favor UPFs by suppressing learning opportunities for LPFs when UPFs were abundant. Learning outcomes were most sensitive to UPF availability. In intervention scenarios, learning shifted toward LPFs only when UPF availability was substantially reduced (from 75.9% to at most 21.6%), with minimal dieting required to initiate extinction. Neither dieting nor reducing UPF reward value alone was sufficient to reverse learning. Overall, both preventing and reversing learning for UPFs requires large reductions in their availability relative to current food environments.Introduction
Ultra-processed foods dominate food environments, referring to the physical, economic, and sociocultural context in which people engage with the food system, including supermarkets and school cafeterias (Davidou et al. 2020; Hendriksen et al. 2021; Monteiro et al. 2013; Ravandi et al. 2025). Ultra-processed foods now contribute to more than half of total energy intake across age groups, and consumption continues to grow (Conway et al. 2024; Neri et al. 2022; Steele et al. 2016). The displacement from less processed toward ultra-processed foods across diets has raised concerns about sustainability and health (Ambikapathi et al. 2022; Fardet & Rock 2020; Monteiro et al. 2025). Not all ultra-processed foods are inherently harmful, and a certain degree of food processing offers clear advantages, and the usefulness of classifying foods by degree of processing remains debated (Astrup et al. 2022; Monteiro et al. 2022; Pellegrini et al. 2025). Still, epidemiological and experimental evidence provides plausible mechanisms for the increase in consumption, and repeatedly associates this with higher risks of obesity, cardio-metabolic disease, mental health issues, and mortality (Forde et al. 2025, 2020; Hall et al. 2019; Juul et al. 2025; Lane et al. 2024; Mendoza et al. 2024).
Food reinforcement learning is suggested to partly promote the consumption of ultra-processed foods (King, 2013; Burger 2023; Small & DiFeliceantonio 2019; Juul et al. 2025). Reinforcement learning is an associative process by which prior experiences with rewards or punishments may shape future choices (Samson et al. 2010; Sutton & Barto 1998). In food reinforcement learning, two systems are suggested to be important: a nutrient-sensing and a perceptive system (Small & DiFeliceantonio 2019). The nutrient-sensing system regulates dopamine release in response to nutrients in the gut, influencing rewards and habit formation (Burger 2023; DiFeliceantonio et al. 2018; Veldhuizen et al. 2017). Ultra-processed foods, particularly those high in fats and carbohydrates, can elicit a supra-additive reward response that is 150%-200% higher than less processed options (DiFeliceantonio et al. 2018; Gearhardt & DiFeliceantonio 2023). Meanwhile, the perceptive system affects food choice based on factors such as liking, flavor, and beliefs about health and cost (Hare et al. 2009; Plassmann et al. 2010). These systems seem to operate independently, which may explain why people continue to salivate over ultra-processed foods despite declining self-reported desire (De Araujo et al. 2013; Kaan & Kleef 2024). Repeated consumption of ultra-processed foods is speculated to alter brain systems related to food reinforcement learning (Burger 2017; Small & DiFeliceantonio 2019).
Through repeated consumption and food reinforcement learning, rewards of foods become associated with food cues such as the taste, the brand’s logo, or consumption contexts (Akker et al. 2017; Berridge & Robinson 1998; Burger 2017). This conditioning process allows people to use previously neutral cues to predict food rewards and motivate intake. Food reinforcement learning and eating in response to food cues is more pronounced in individuals with obesity, who may overgeneralize eating responses to a wider range of cues (Akker et al. 2017; Ferriday & Brunstrom 2011; Jansen et al. 2010; Weydmann et al. 2024). Additionally, people may be more genetically predisposed to food reinforcement learning, making them more responsive to food cues in the food environment (Paquet et al. 2010, 2021).
Extinction describes how conditioned responses to food cues may weaken over time when cues are repeatedly encountered without consumption (Bouton 2011). Interventions that teach individuals to encounter foods but not consume them (go/no-go training) rely on extinction (Veling et al. 2011). However, extinction has proven fragile, with its effectiveness often undermined by an abundance of ultra-processed foods and cues in the food environment (Bouton 2011). Interventions that alter the food environment to be healthier have shown improvements in eating behavior (Driessen et al. 2014; Pinho et al. 2024). This raises the question: how does extinction shape food reinforcement learning following interventions targeting the individual, the food environment, or both?
Studying how extinction impacts food reinforcement learning following interventions targeting the individual, the food environment, or both is experimentally challenging in real life. This is because real-life food environments are difficult to control, and extinction processes unfold over extended periods, making it hard to isolate the effects of specific interventions. To address this challenge, we developed a microsimulation model that explicitly incorporates extinction. While previous models have examined how timing of exposure and different food environments influence food reinforcement learning or how policies affect ultra-processed food purchasing, they have not accounted for extinction (Hammond et al. 2012; Langellier et al. 2022; Schauder et al. 2020). Without extinction, models may fail to predict changes in food reinforcement learning when foods are encountered but not consumed. We therefore simulated how extinction influences food reinforcement learning following interventions targeting the individual, the food environment, or both.
Methods
The model was inspired by Hammond et al. (2012), who used Temporal Difference Learning to examine how timing and exposure to food environments shape food reinforcement learning. Here, we extend this approach by integrating extinction into a Rescorla-Wagner reinforcement learning model. The model was developed in Python 3.11.2. and is open-source and available via GitHub: https://github.com/kajijoo/abm. The ODD+D protocol describing the model can be found in the Appendix (Müller et al. 2013).
Eating decision loop
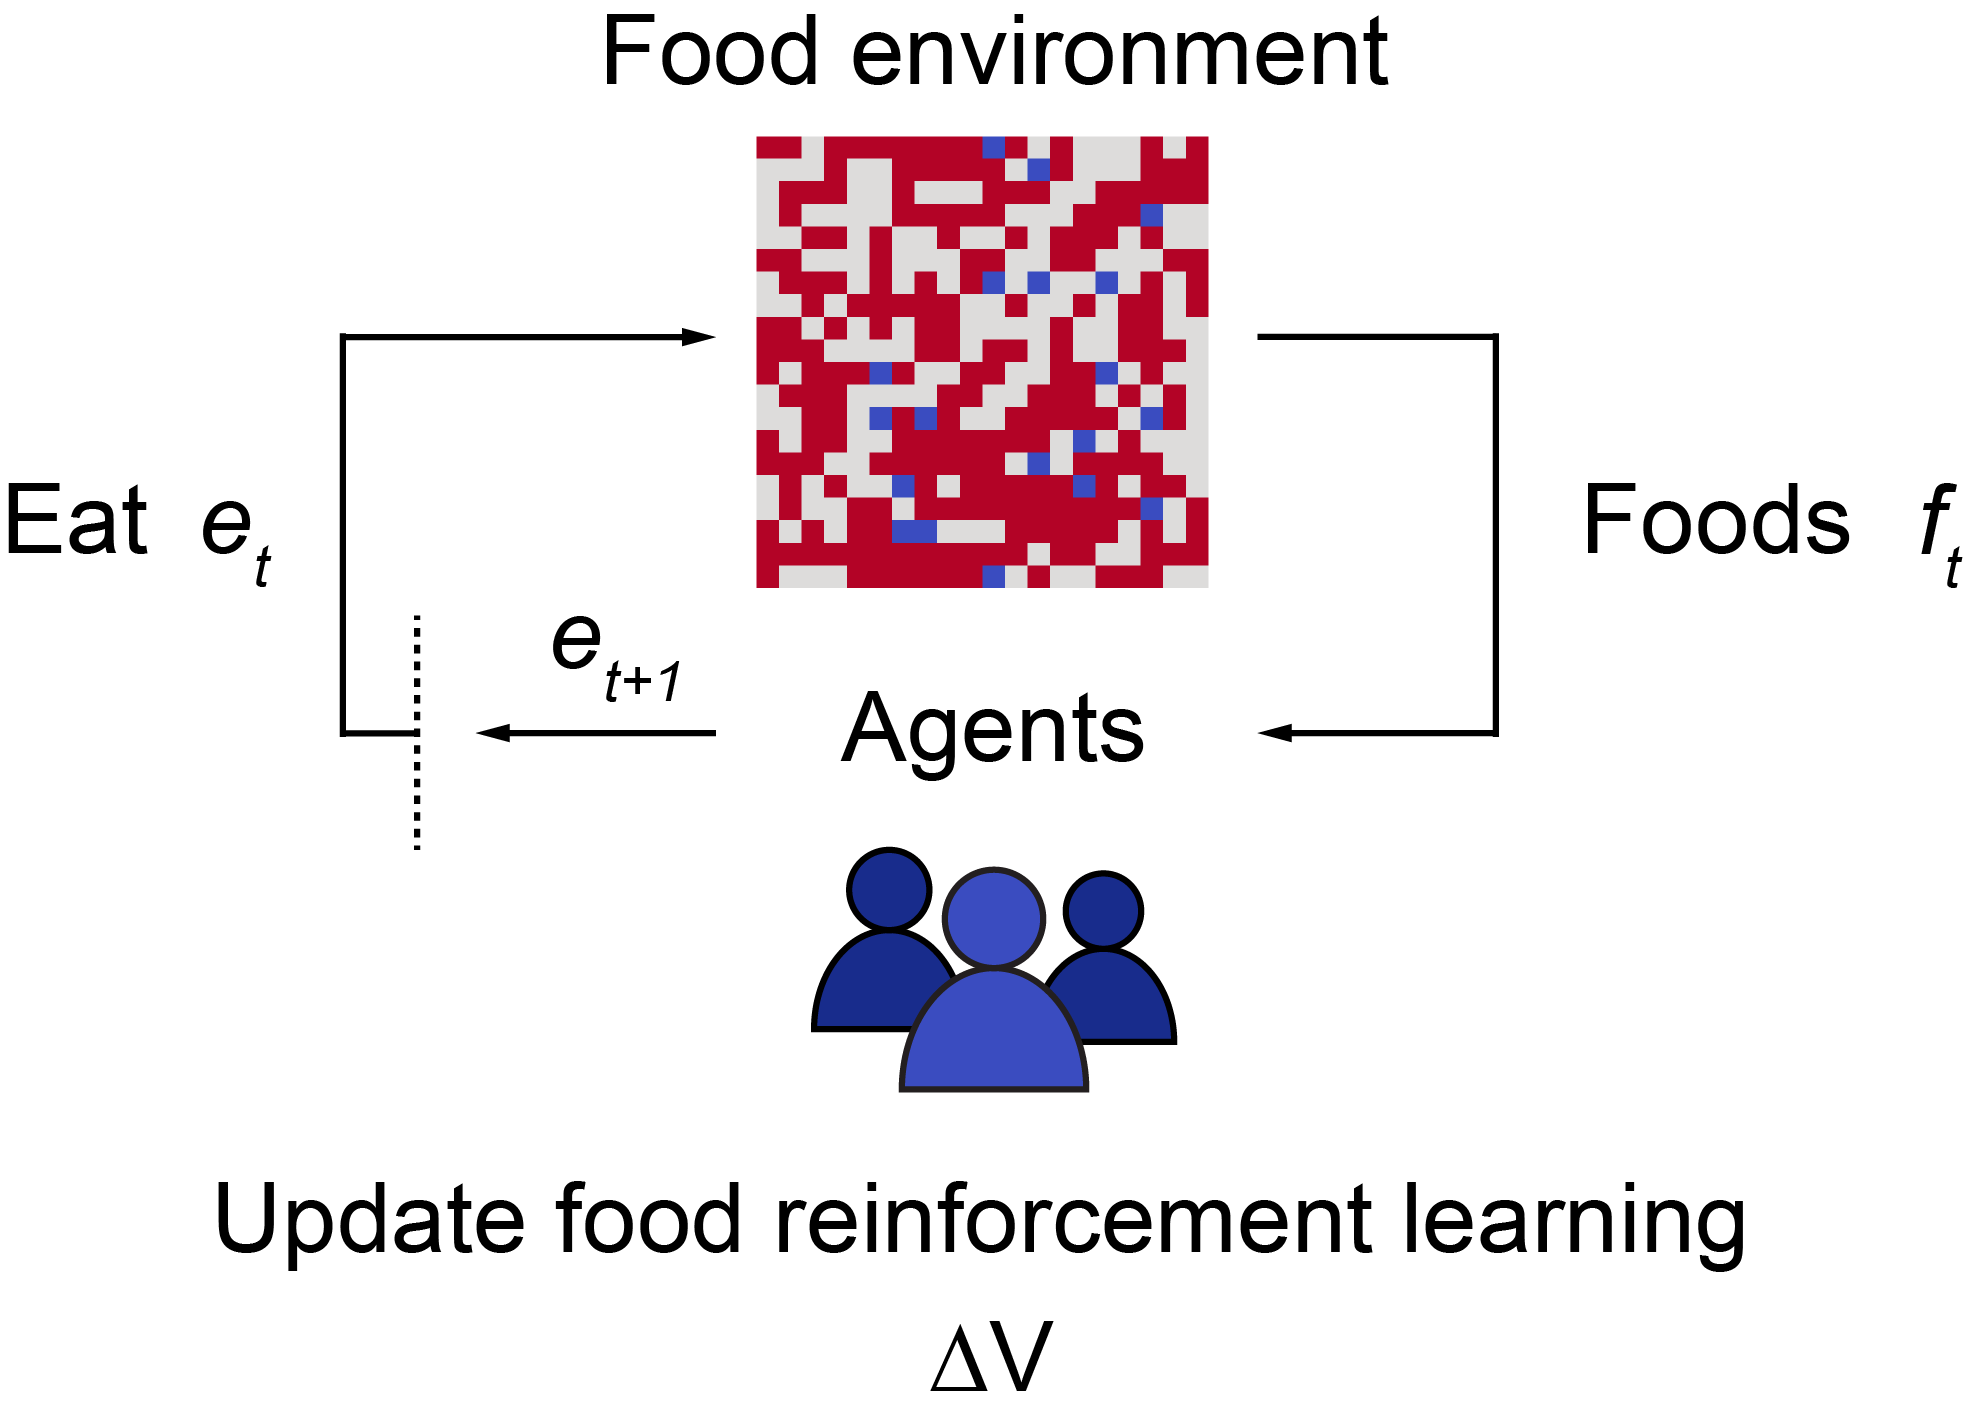
Figure 1 shows a schematic overview of the eating decision loop. At each time step \(t\), an agent that resembles a person took the following actions:
- The agent moved one step to the right in the food environment.
- The agent encountered either two less processed foods, two ultra-processed foods, or one of each.
- The agent chose and consumed one of the available foods.
- The agent experienced the reward associated with the consumed food.
- The expected reward value of the consumed food was updated.
- Extinction was applied to the non-consumed food if exposed to both foods.
- Repeat.
Food environment
The food environment that the agents moved through was abstracted and contained two types of food: low-reward (L; representing less processed foods) and high-reward (H; representing ultra-processed foods). The environment was a torus grid where each cell contained two food items. Each agent occupied one row of the grid, beginning on the left side and moving one cell to the right where agents encountered two food types. The availability of food types was assigned using:
| \[P(H) = p, \quad P(L) = 1 - P(H)\] | \[(1)\] |
Food choice rule
As agents traversed the food environment and encountered foods, they made decisions based on their expected reward values for low-reward (\(V_L\)) and high-reward foods (\(V_H\)). In cells containing only LL or HH foods, choice was deterministic. In mixed HL cells, the probability of eating the low-reward food at time \(t\) was:
| \[e_t(L) = \begin{cases} 1-\varepsilon & \text{if $V_L > V_H$}, \\ \varepsilon & \text{if $V_L < V_H$}, \\ 0.5 & \text{if $V_L = V_H$}, \end{cases}\] | \[(2)\] |
Reinforcement learning model
After consumption, the expected reward values are updated through reinforcement learning. We used the Rescorla–Wagner model, in which learning is driven by prediction errors, that is, the difference between expected and experienced rewards (Rescorla & Wagner, 1972; Sutton, 1988; Schultz 2016; Jozefowiez 2018). As people consume foods and experience the reward response associated with the nutrient signaling from the gut to the brain (Small & DiFeliceantonio 2019), they may start to associate this reward with the food and its cues, such as its smell (Akker et al. 2017; Berridge & Robinson 1998; Burger 2017). This process can be captured by:
| \[\Delta V = \alpha \beta (\lambda - V)\] | \[(3)\] |
Within the context of eating, Rescorla-Wagner naturally captures both reward acquisition and extinction. Repeated consumption of a food strengthens its expected reward value, while encountering a food without eating and experiencing the reward weakens it. Extinction thus reduces \(V\) when a food is encountered but not eaten. We modeled the gradual weakening of learned reward values as follows:
| \[\Delta V = \alpha \beta \gamma (\lambda - V), \quad \lambda = 0\] | \[(4)\] |
| \[\Delta V = -\alpha \beta \gamma V\] | \[(5)\] |
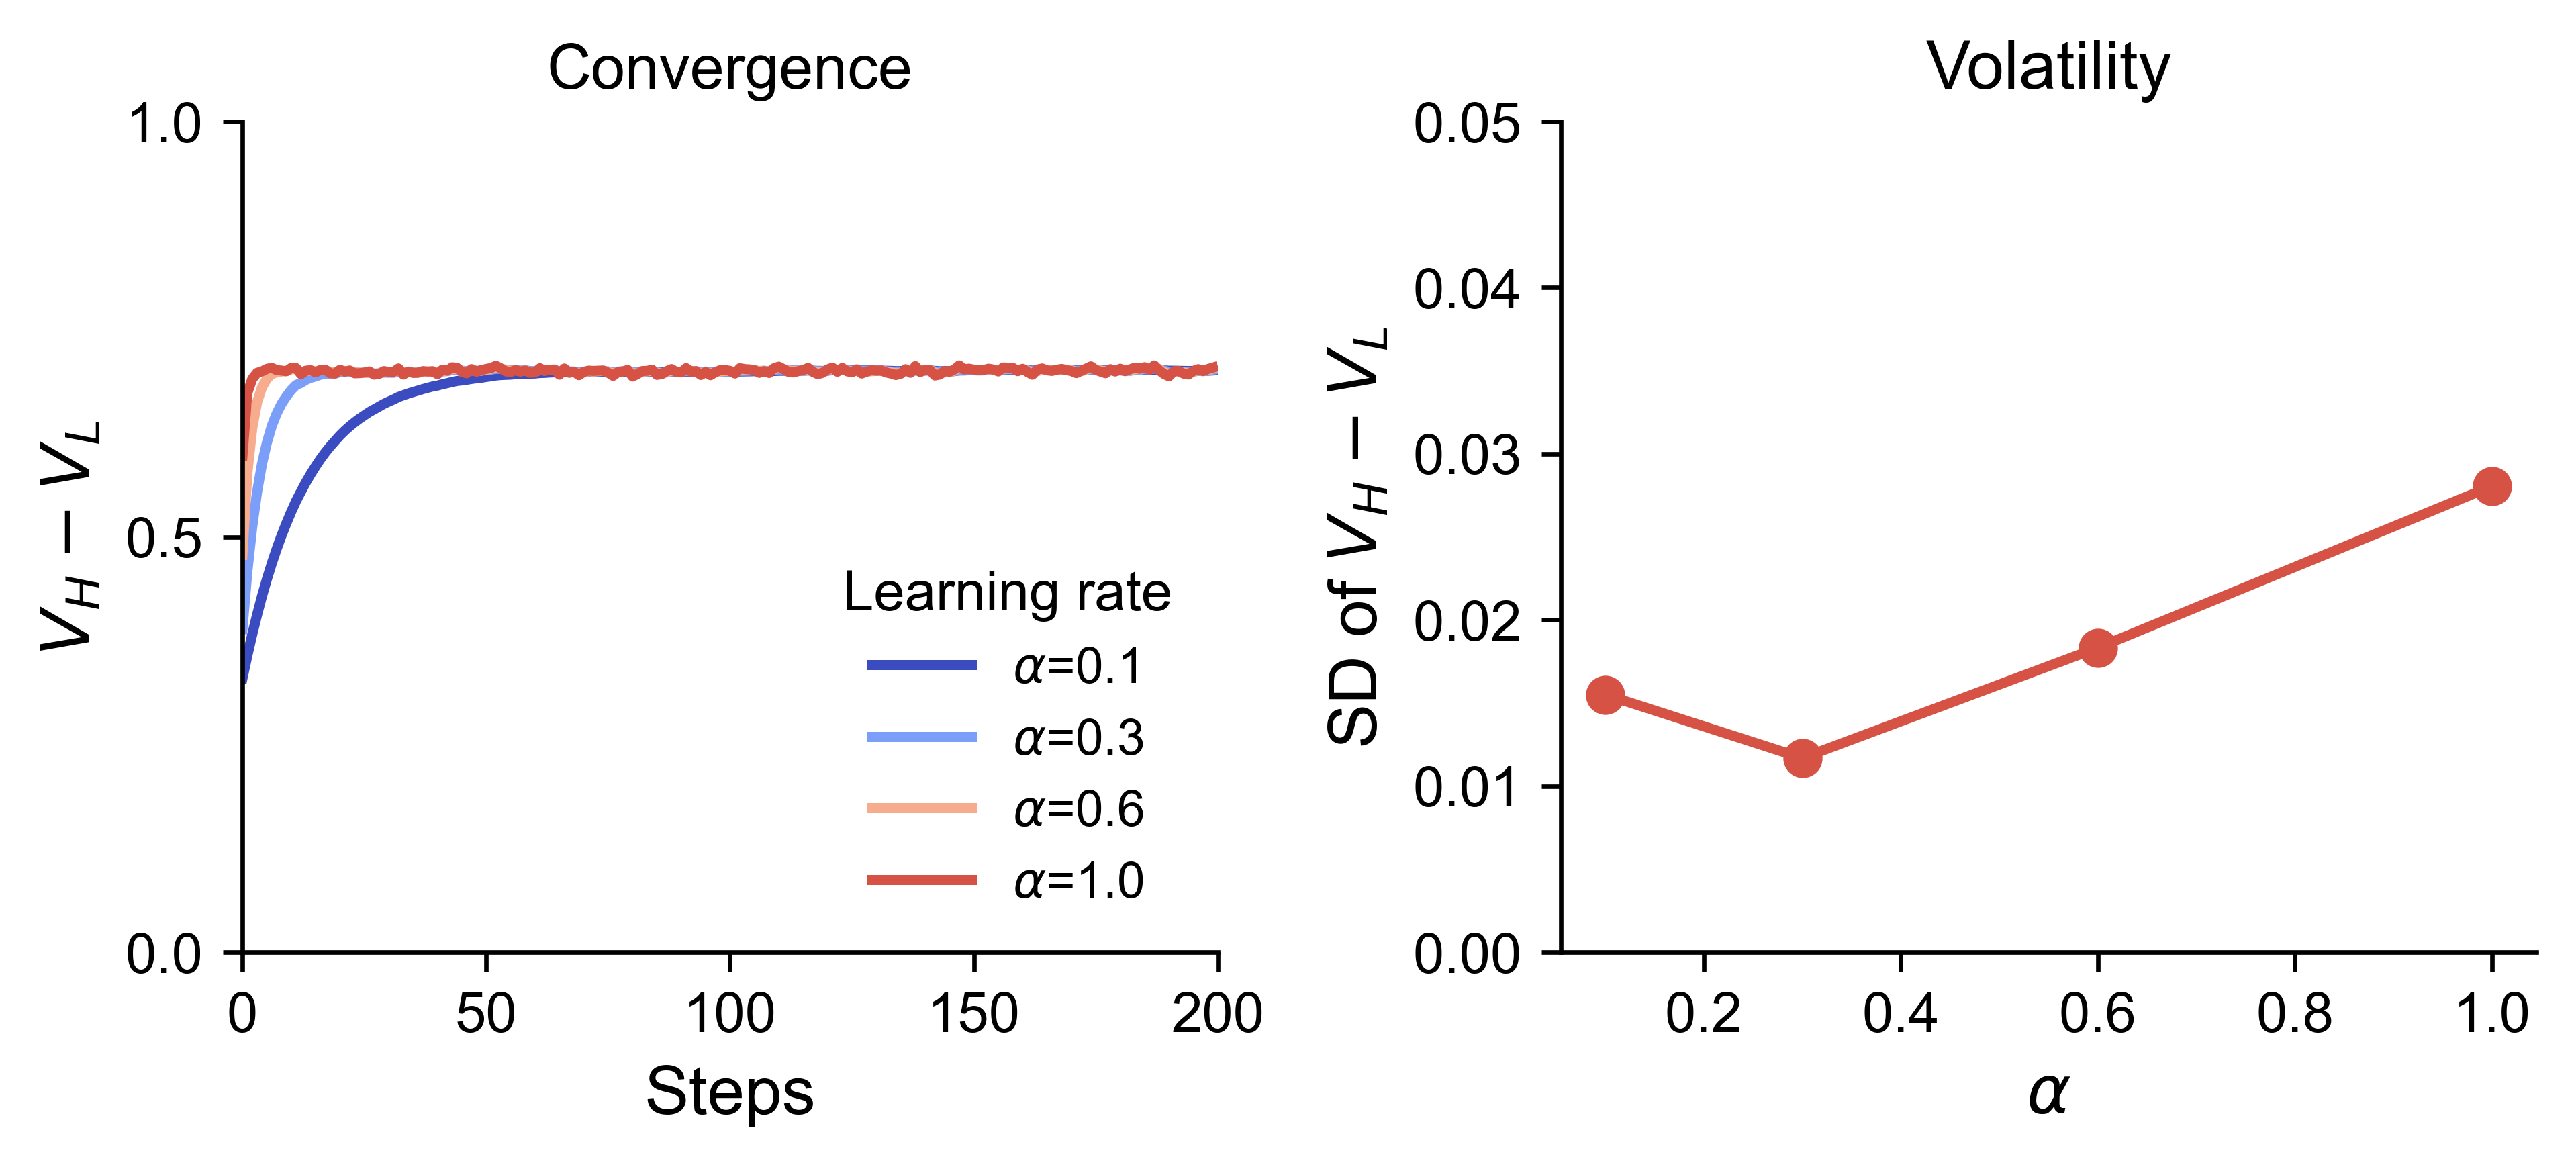
The model with extinction converged at around 100 steps for all learning rates (\(\alpha\)) (Figure 2). The volatility of learning at the agent level increased for higher, and faster learning rates indicating that learning was relatively unstable for agents. To smooth learning trajectories of agents, we fixed the effective learning rate (\(\alpha\beta)\) to 0.3 in all further analyses.
Simulation experiments
In each experiment, a grid search was conducted for the parameters of interest with 20 Monte Carlo replications per grid cell and results were averaged. Each simulation consisted of 100 steps to ensure convergence. A single simulation run included 100 agents moving across a \(100 \times 100\) torus grid. Agents began simulations with no prior learning (\(V_H = V_L = 0\)) unless otherwise stated. The primary outcome measure was the difference in expected reward values, \(V_H-V_L\), and the proportion of consumed low-reward foods, \(L/(L+H)\).
1: Prevention
The first experiment examined how extinction interacts with the food environment to shape reinforcement learning in a prevention scenario (Table 1). In this scenario, we examined under what conditions agents can be prevented from learning that high-reward foods are more rewarding. For instance, a prevention scenario could illustrate a child growing up in a food environment where ultra-processed foods are less available. To do so, agents entered the environment without prior learning, meaning agents had no expected reward values for either food type yet (\(V_H = V_L = 0\)). We systematically varied the extinction rate (\(\gamma\)) and the availability of high-reward foods (\(P(H)\)), while holding the dieting probability (\(\varepsilon\)) constant. Two levels of reward contrast (\(\lambda_H/\lambda_L\)) were considered, corresponding to moderate and strong differences between high- and low-reward foods. For each parameter combination, simulations were repeated across independent runs and the mean difference in learned reward values, \(V_H - V_L\), was recorded. From this, we also isolated the specific contribution of extinction by comparing outcomes with and without extinction.
Additionally, we conducted a global sensitivity analysis on the main outcome, \(V_H-V_L\) (Marino et al. 2008). We generated 500 parameter sets by sampling uniformly from the ranges of high-reward food availability (\(P(H)\)), the dieting probability (\(\varepsilon\)), the reward value of high-reward foods (\(\lambda_H\)), the extinction rate (\(\gamma\)), and the effective learning rate (\(\alpha\beta\)). For each parameter set, we ran the model 20 times and computed the average \(V_H-V_L\). We then estimated each parameter’s influence using Partial Rank Correlation Coefficients (PRCC), which quantify the direction and strength of the association with \(V_H-V_L\) while controlling for the other parameters.
2: Interventions - Dieting and food availability
The second experiment investigated how extinction impacts expected reward values following interventions targeting the individual, the food environment, or both. In this scenario, we were interested in how interventions can reverse learning toward low-reward foods if agents have already learned that high-reward foods are more rewarding. For instance, an intervention scenario could describe an adult who has already learned that ultra-processed foods are more rewarding and then moves to a food environment where these foods are less available or starts dieting.
To clarify the role of extinction in intervention settings, we first showed some example simulations where we conducted both interventions after a learning phase with and without extinction. After, we moved on to the main simulations consisting of a learning phase followed by an intervention phase. In the learning phase, agents were exposed to a realistic food environment resembling American supermarkets. The learned expected reward values were then used as initial conditions for the intervention phase. In the intervention phase, we manipulated both the availability of high-reward foods (\(P(H)\)) and the dieting probability (\(\varepsilon\)). This allowed us to examine the independent and combined effects of individual-level and food environment-level interventions on expected reward values.
3: Interventions - Food reward and availability
Furthermore, we intervened at the level of the food environment by changing the reward value of high-reward foods (\(\lambda_H\)) as well as the availability of high-reward foods (\(P(H)\)). This intervention scenario could describe an adult who has already learned that ultra-processed foods are more rewarding and then moves to a food environment where these foods are less available or less rewarding due to higher sugar taxes. Again, agents first underwent a learning phase in a realistic food environment resembling American supermarkets. After, we manipulated both the availability of high-reward foods and the reward value of high-reward foods. This allowed us to examine the independent and combined effects of two interventions targeting the food environment.
Parameters
In the first experiment we simulated a prevention scenario by systematically varying the extinction rate (\(\gamma\)) and the availability of high-reward foods (\(P(H)\)) without any prior learning (ranges provided in Table 1). We fixed the dieting probability (\(\varepsilon\)) to zero based on the assumption that dieting is not necessary in the case of successful prevention. The reward values were informed by findings from nutritional neuroscience. Ultra-processed foods, typically those high in sugars and fats, produce stronger reward responses than less processed foods, with estimates around 150–200% higher (DiFeliceantonio et al. 2018). We therefore set \(\lambda_L=0.5\) and used \(\lambda_H \in \{0.75,1.0\}\) corresponding to 150–200% stronger reward responses.
In the second experiment we simulated an intervention scenario where agents first learned reward values for low- and high-reward foods in a realistic food environment while keeping all other parameters the same. To approximate a realistic food environment, we estimated the availability of ultra-processed products in American supermarkets using an open-access database by Ravandi et al. (2025). We used this database because it is extensive (50,000+ products) and enabled us to verify and calculate the availability of ultra-processed foods ourselves. Across supermarkets, 75.9% of the total products were classified as ultra-processed according to the NOVA classification scores readily available in the database. Therefore, we set the availability of ultra-processed foods to \(P(H)=0.759\) in the learning phase. In the intervention phase, we systematically varied the dieting probability parameter (\(\varepsilon\)) and the availability of high-reward foods (\(P(H)\)).
In the third experiment the learning phase was the same as in the second experiment, but we systematically varied the reward value of the high-reward foods (\(\lambda_H\)) and the availability of high-reward foods in the food environment (\(P(H)\)) in the intervention phase. Moreover, a small dieting probability was introduced to start the extinction process after the learning phase.
| Parameter | Description | 1 | 2 | 3 | ||
| Learning | Intervention | Learning | Intervention | |||
| Agents | Number of agents | 100 | 100 | 100 | 100 | 100 |
| Time steps | Duration of run | 100 | 100 | 100 | 100 | 100 |
| Replicates | Number of runs | 20 | 20 | 20 | 20 | 20 |
| \( \alpha\beta \) | Effective learning rate | 0.3 | 0.3 | 0.3 | 0.3 | 0.3 |
| \( \gamma \) | Extinction rate | 0–1 | 1 | 1 | 1 | 1 |
| \( \lambda_H \) | Reward value high-reward food | 0.75, 1.0 | 0.75, 1.0 | 0.75, 1.0 | 0.75, 1.0 | 0.5–1.0 |
| \( \lambda_L \) | Reward value low-reward food | 0.5 | 0.5 | 0.5 | 0.5 | 0.5 |
| \( P(H) \) | Prevalence H in food environment | 0.0–1.0 | 0.759 | 0.0–1.0 | 0.759 | 0.0–1.0 |
| \( \varepsilon \) | Dieting probability | 0 | 0 | 0–1 | 0 | 0.05 |
Results
1: Prevention
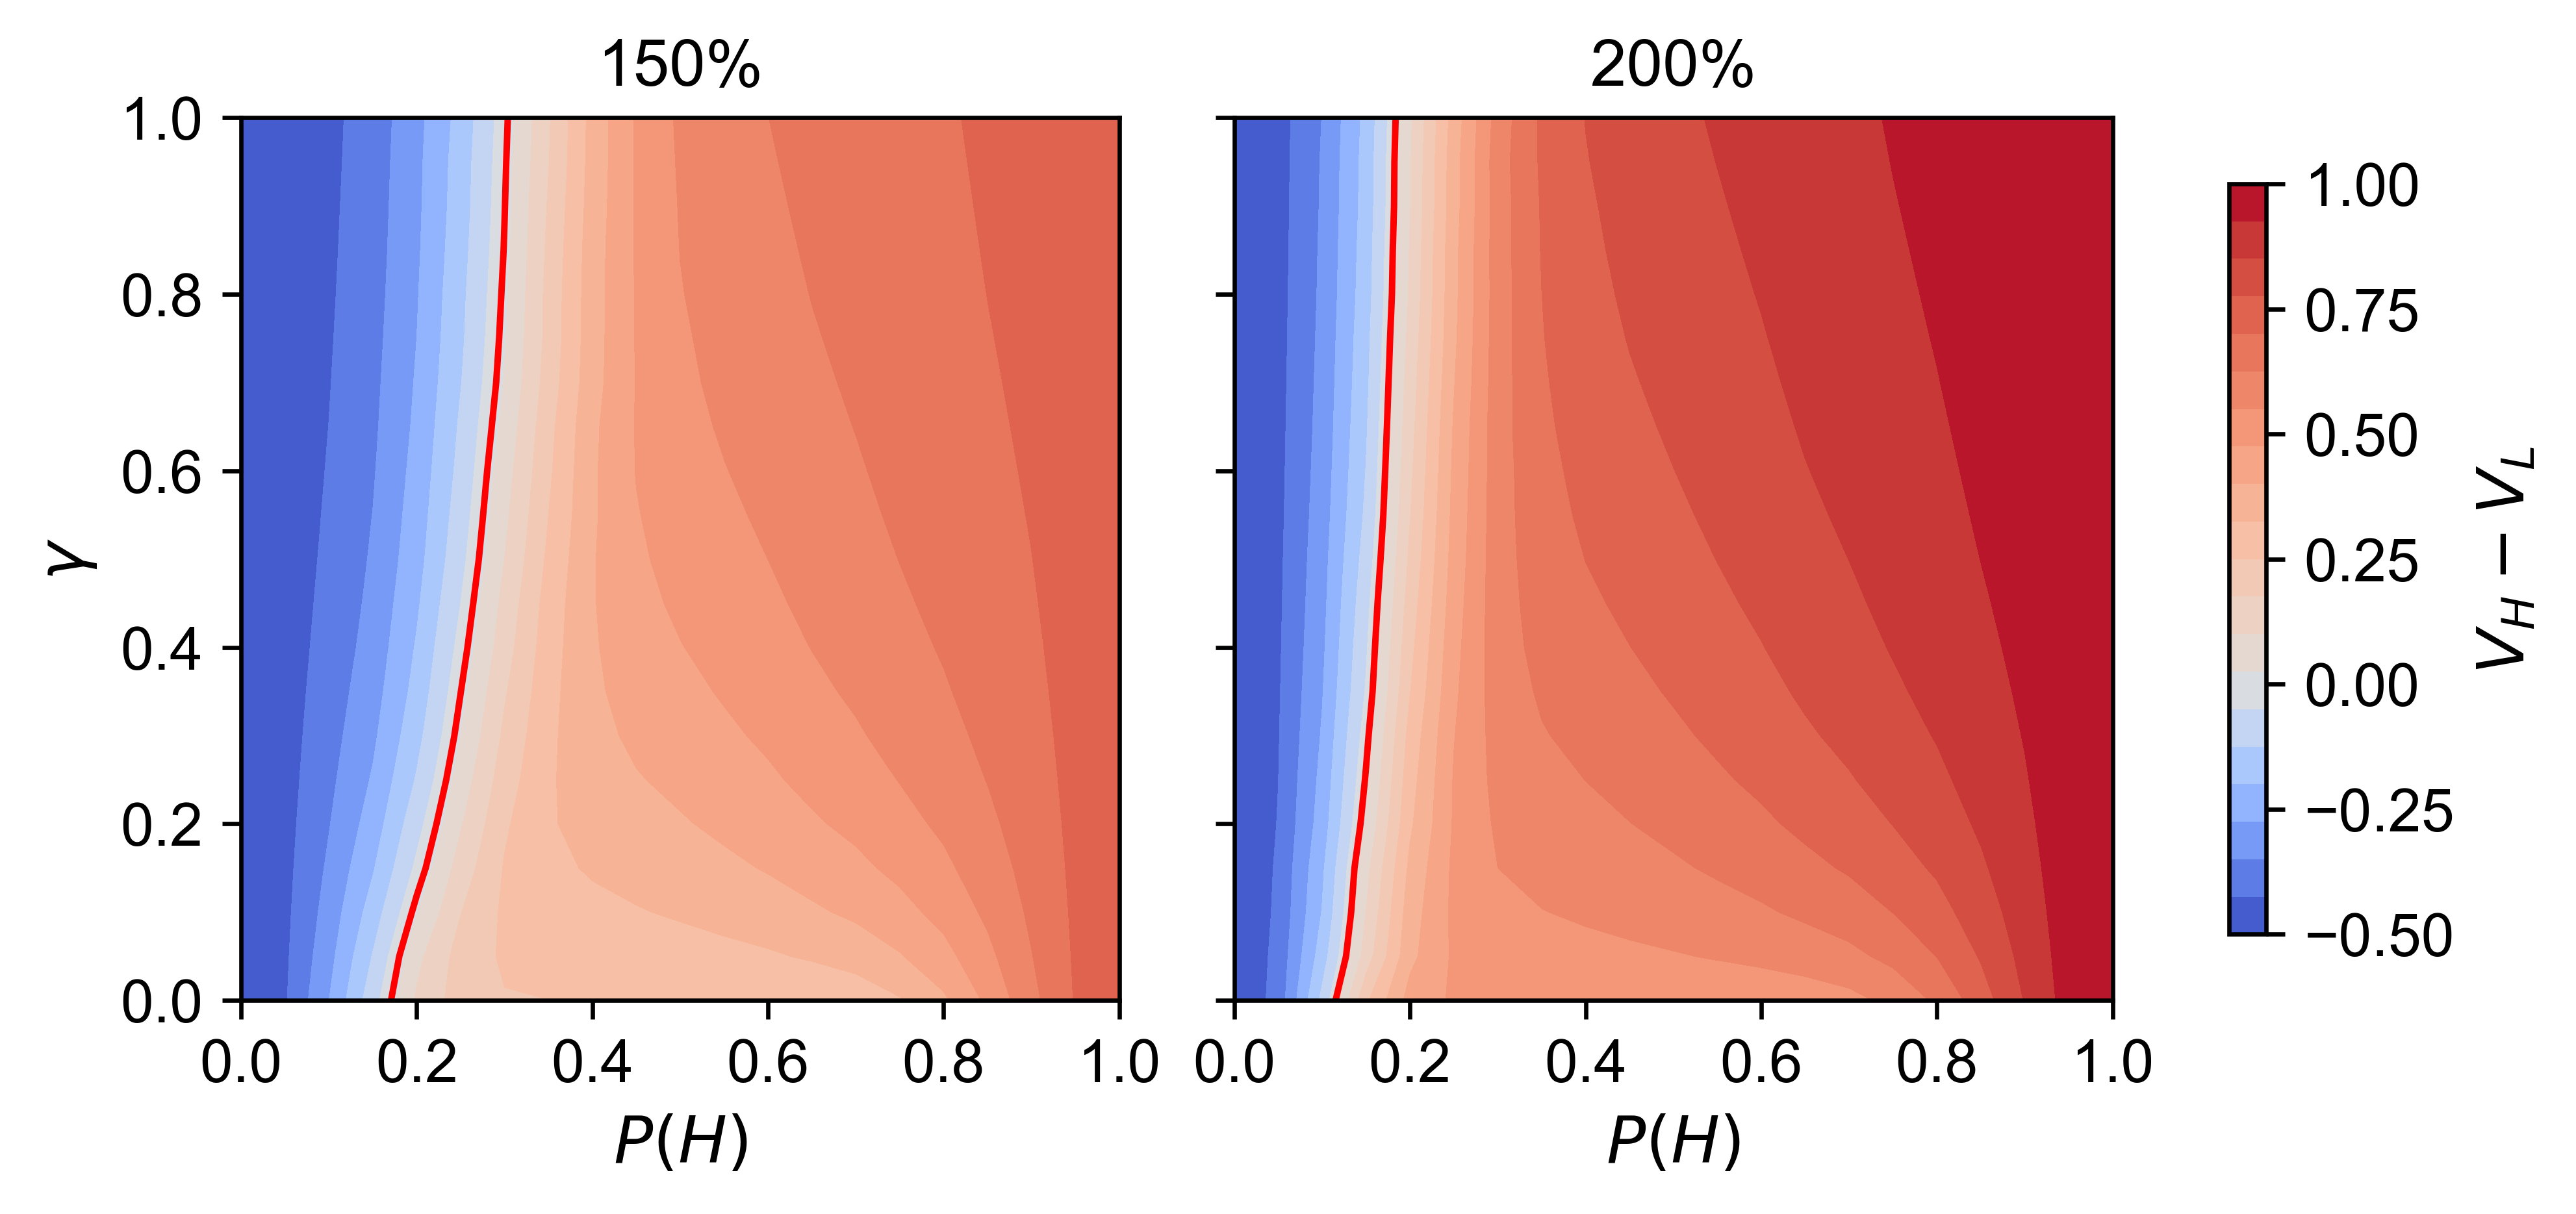
Figure 3 shows the difference in expected reward values for high- and low-reward foods (\(V_H - V_L\)) when agents enter the food environment without prior learning to simulate a prevention scenario. Outcomes are shown as a function of the extinction rate (\(\gamma\)) and the availability of high-reward foods (\(P(H)\)), for environments in which high-reward foods are either 150% or 200% more rewarding than low-reward foods.
Across both reward contrasts, reinforcement learning outcomes depend strongly on the availability of high-reward foods. Importantly, learning only shifts in favor of low-reward foods when the availability of high-reward foods is extremely low, regardless of extinction. In both reward scenarios, \(V_H - V_L \leq 0\) occurs only when high-reward foods make up a small minority of the food environment (up to 30.3% in the 150% scenario, and up to 18.3% in the 200% scenario). As the availability of high-reward foods increases even modestly, reinforcement learning quickly shifts from the low- toward the high-reward food.
Extinction slightly increases the availability of high-reward foods in the food environment where low-reward foods are still favored. For example, when high-reward foods are 150% more rewarding, learning shifts toward low-reward foods when \(P(H) = 0.171\) in the absence of extinction (\(\gamma = 0\)), compared to \(P(H) = 0.303\) with extinction (\(\gamma = 1\)). When the reward contrast is stronger (200%), the corresponding thresholds occur at \(P(H)=0.115\) and \(P(H)=0.183\). In other words, shifting learning in favor of low-reward foods requires little availability of high-reward foods in the food environment, and this tolerance decreases even further as the reward contrast increases.
To isolate the specific contribution of extinction, Figure 4 shows how the \(V_H - V_L\) gap changes when extinction is introduced (\(\gamma=1\)) relative to when it is absent (\(\gamma=0\)). Positive values indicate that extinction increases the gap in favor of high-reward foods, whereas negative values indicate that extinction increases the gap in favor of low-reward foods. The effect of extinction is non-linear across food environments. When high-reward foods are rare (low \(P(H)\)), extinction widens the gap in favor of low-reward foods. As high-reward foods become more prevalent, the effect reverses and extinction widens the gap in favor of high-reward foods. The effect disappears at the boundaries (\(P(H)=0\) and \(P(H)=1\)), where extinction cannot occur because one of the food types is never encountered.
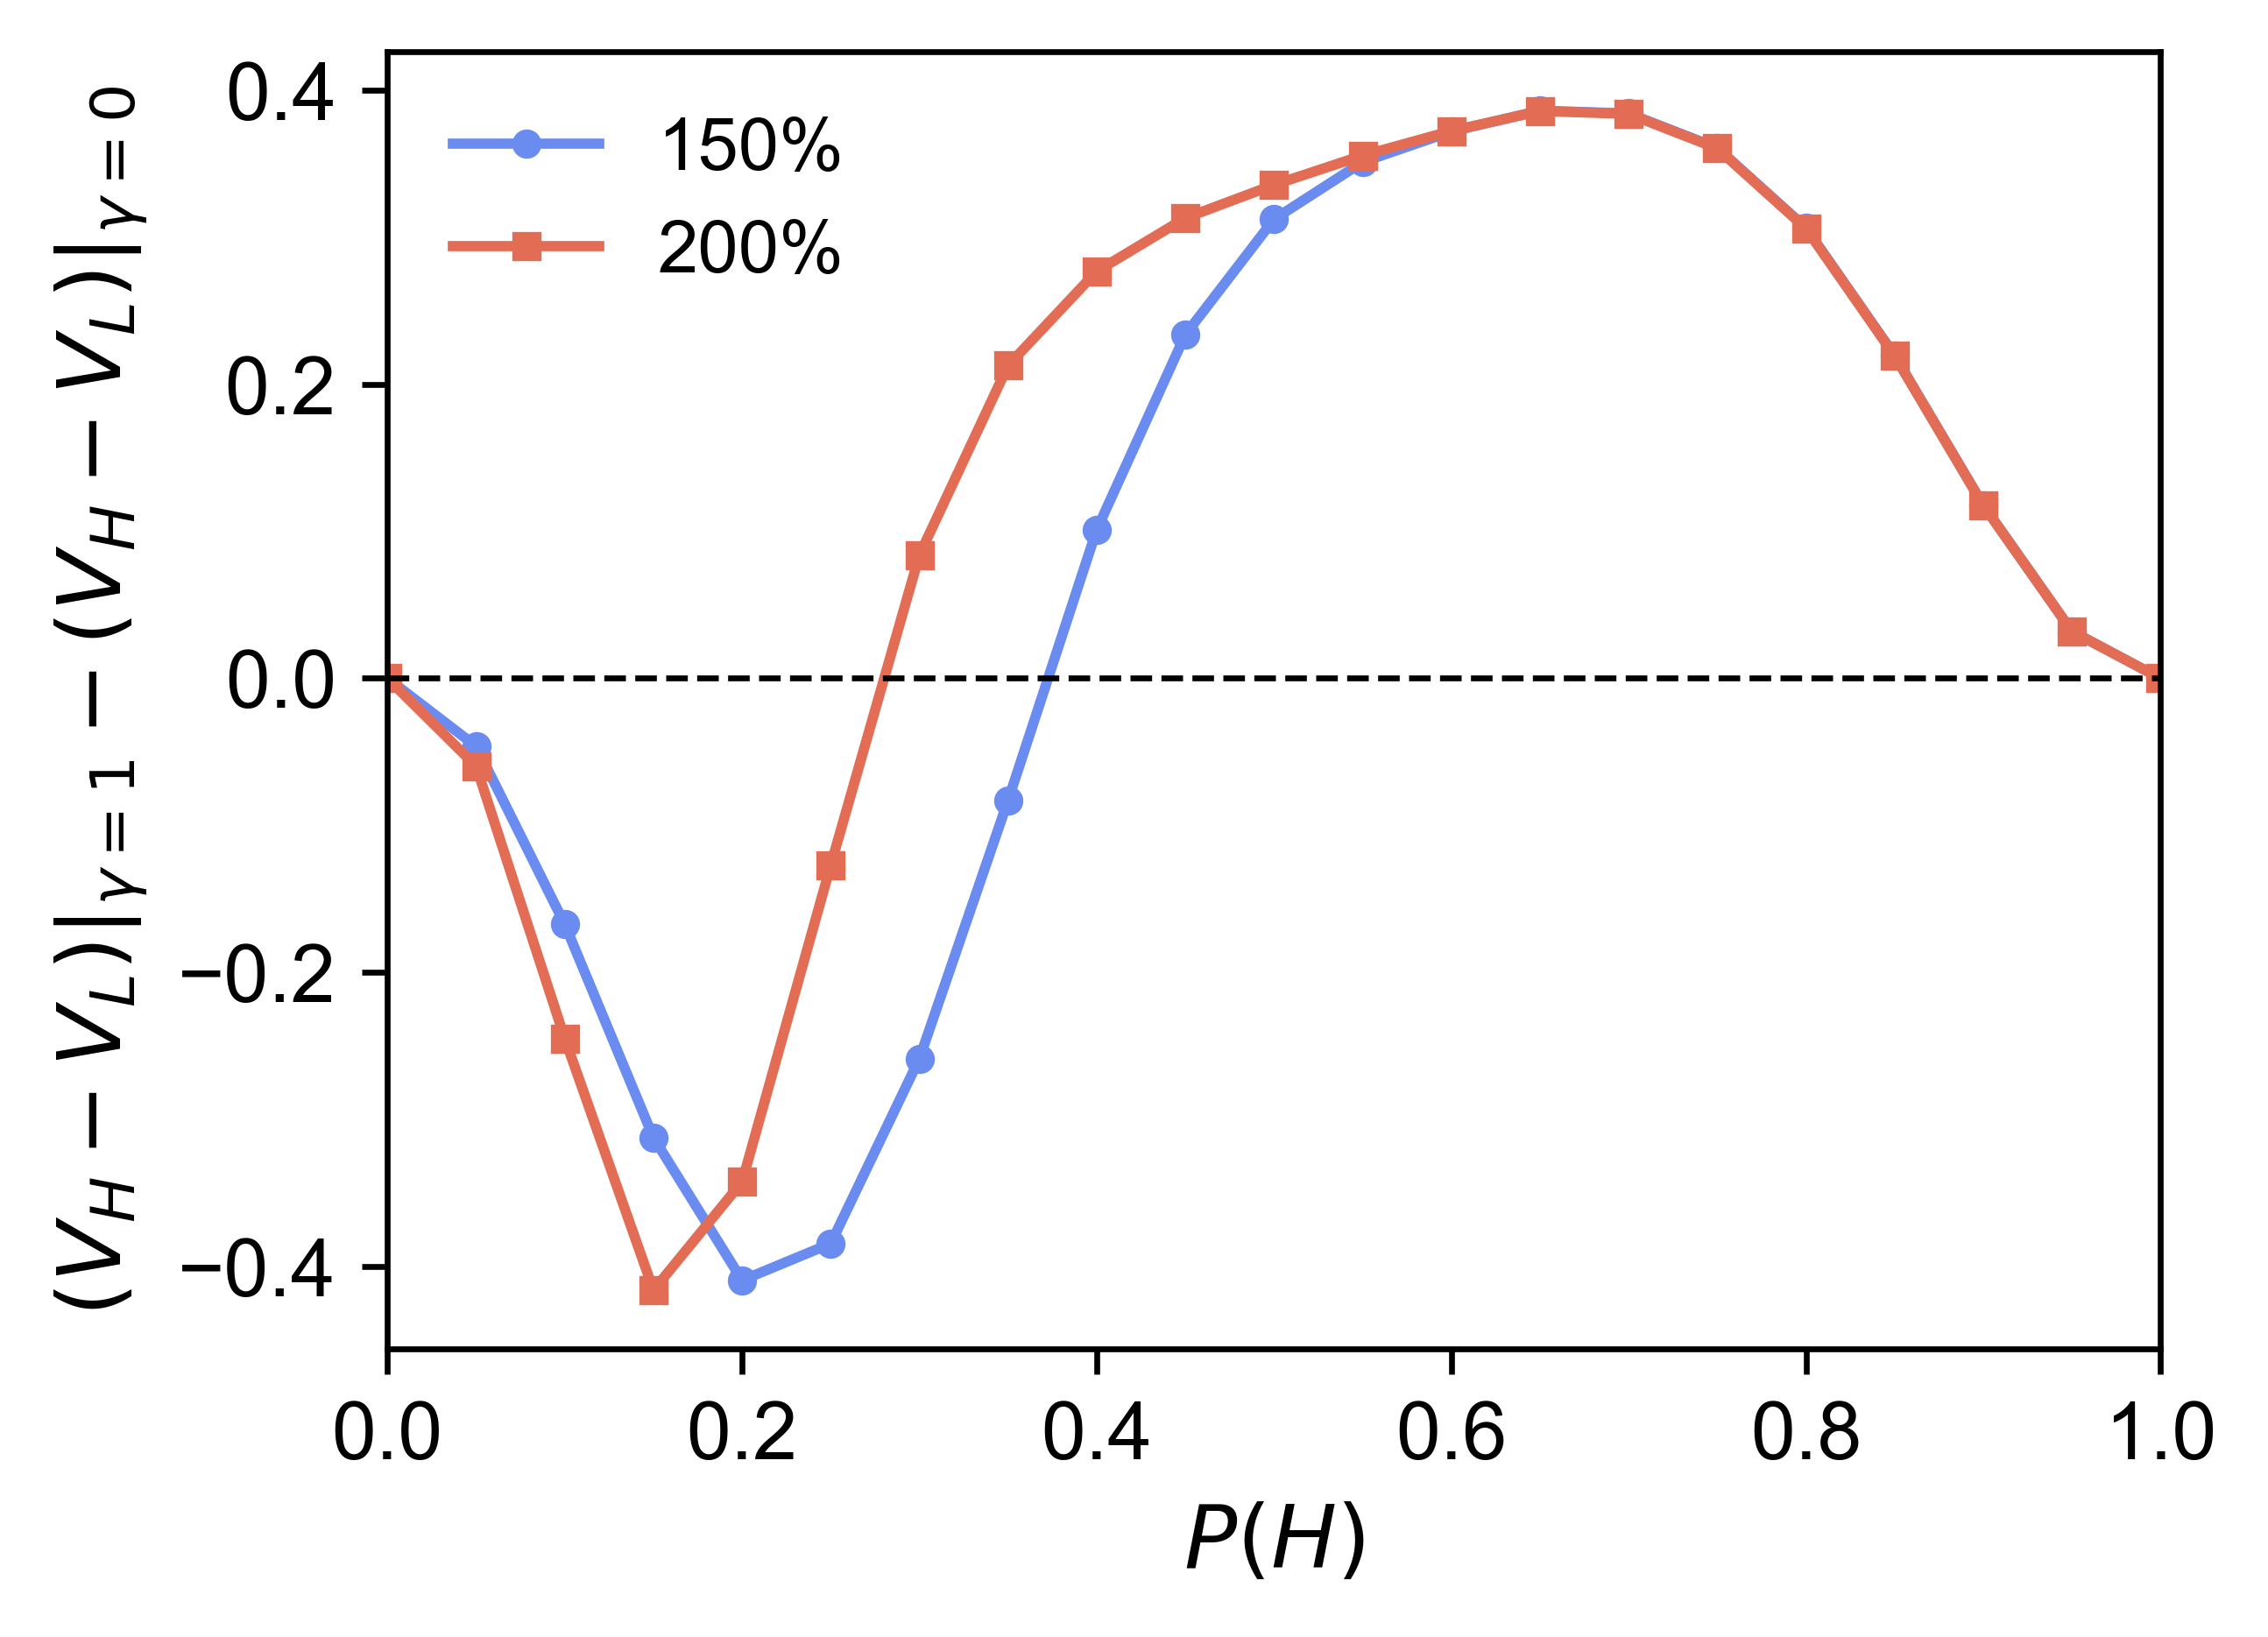
The effect of extinction on \(V_H-V_L\) is asymmetric, demonstrated by a transition from negative to positive values before the food environment becomes balanced \(P(H) = 0.5\). Because high-reward foods produce larger reinforcement updates, the shift toward positive effects of extinction occurs at relatively low availability levels of high-reward foods. For instance, when high-reward foods are 200% more rewarding, extinction already begins to widen the gap in favor of high-reward foods at \(P(H) = 0.30\).
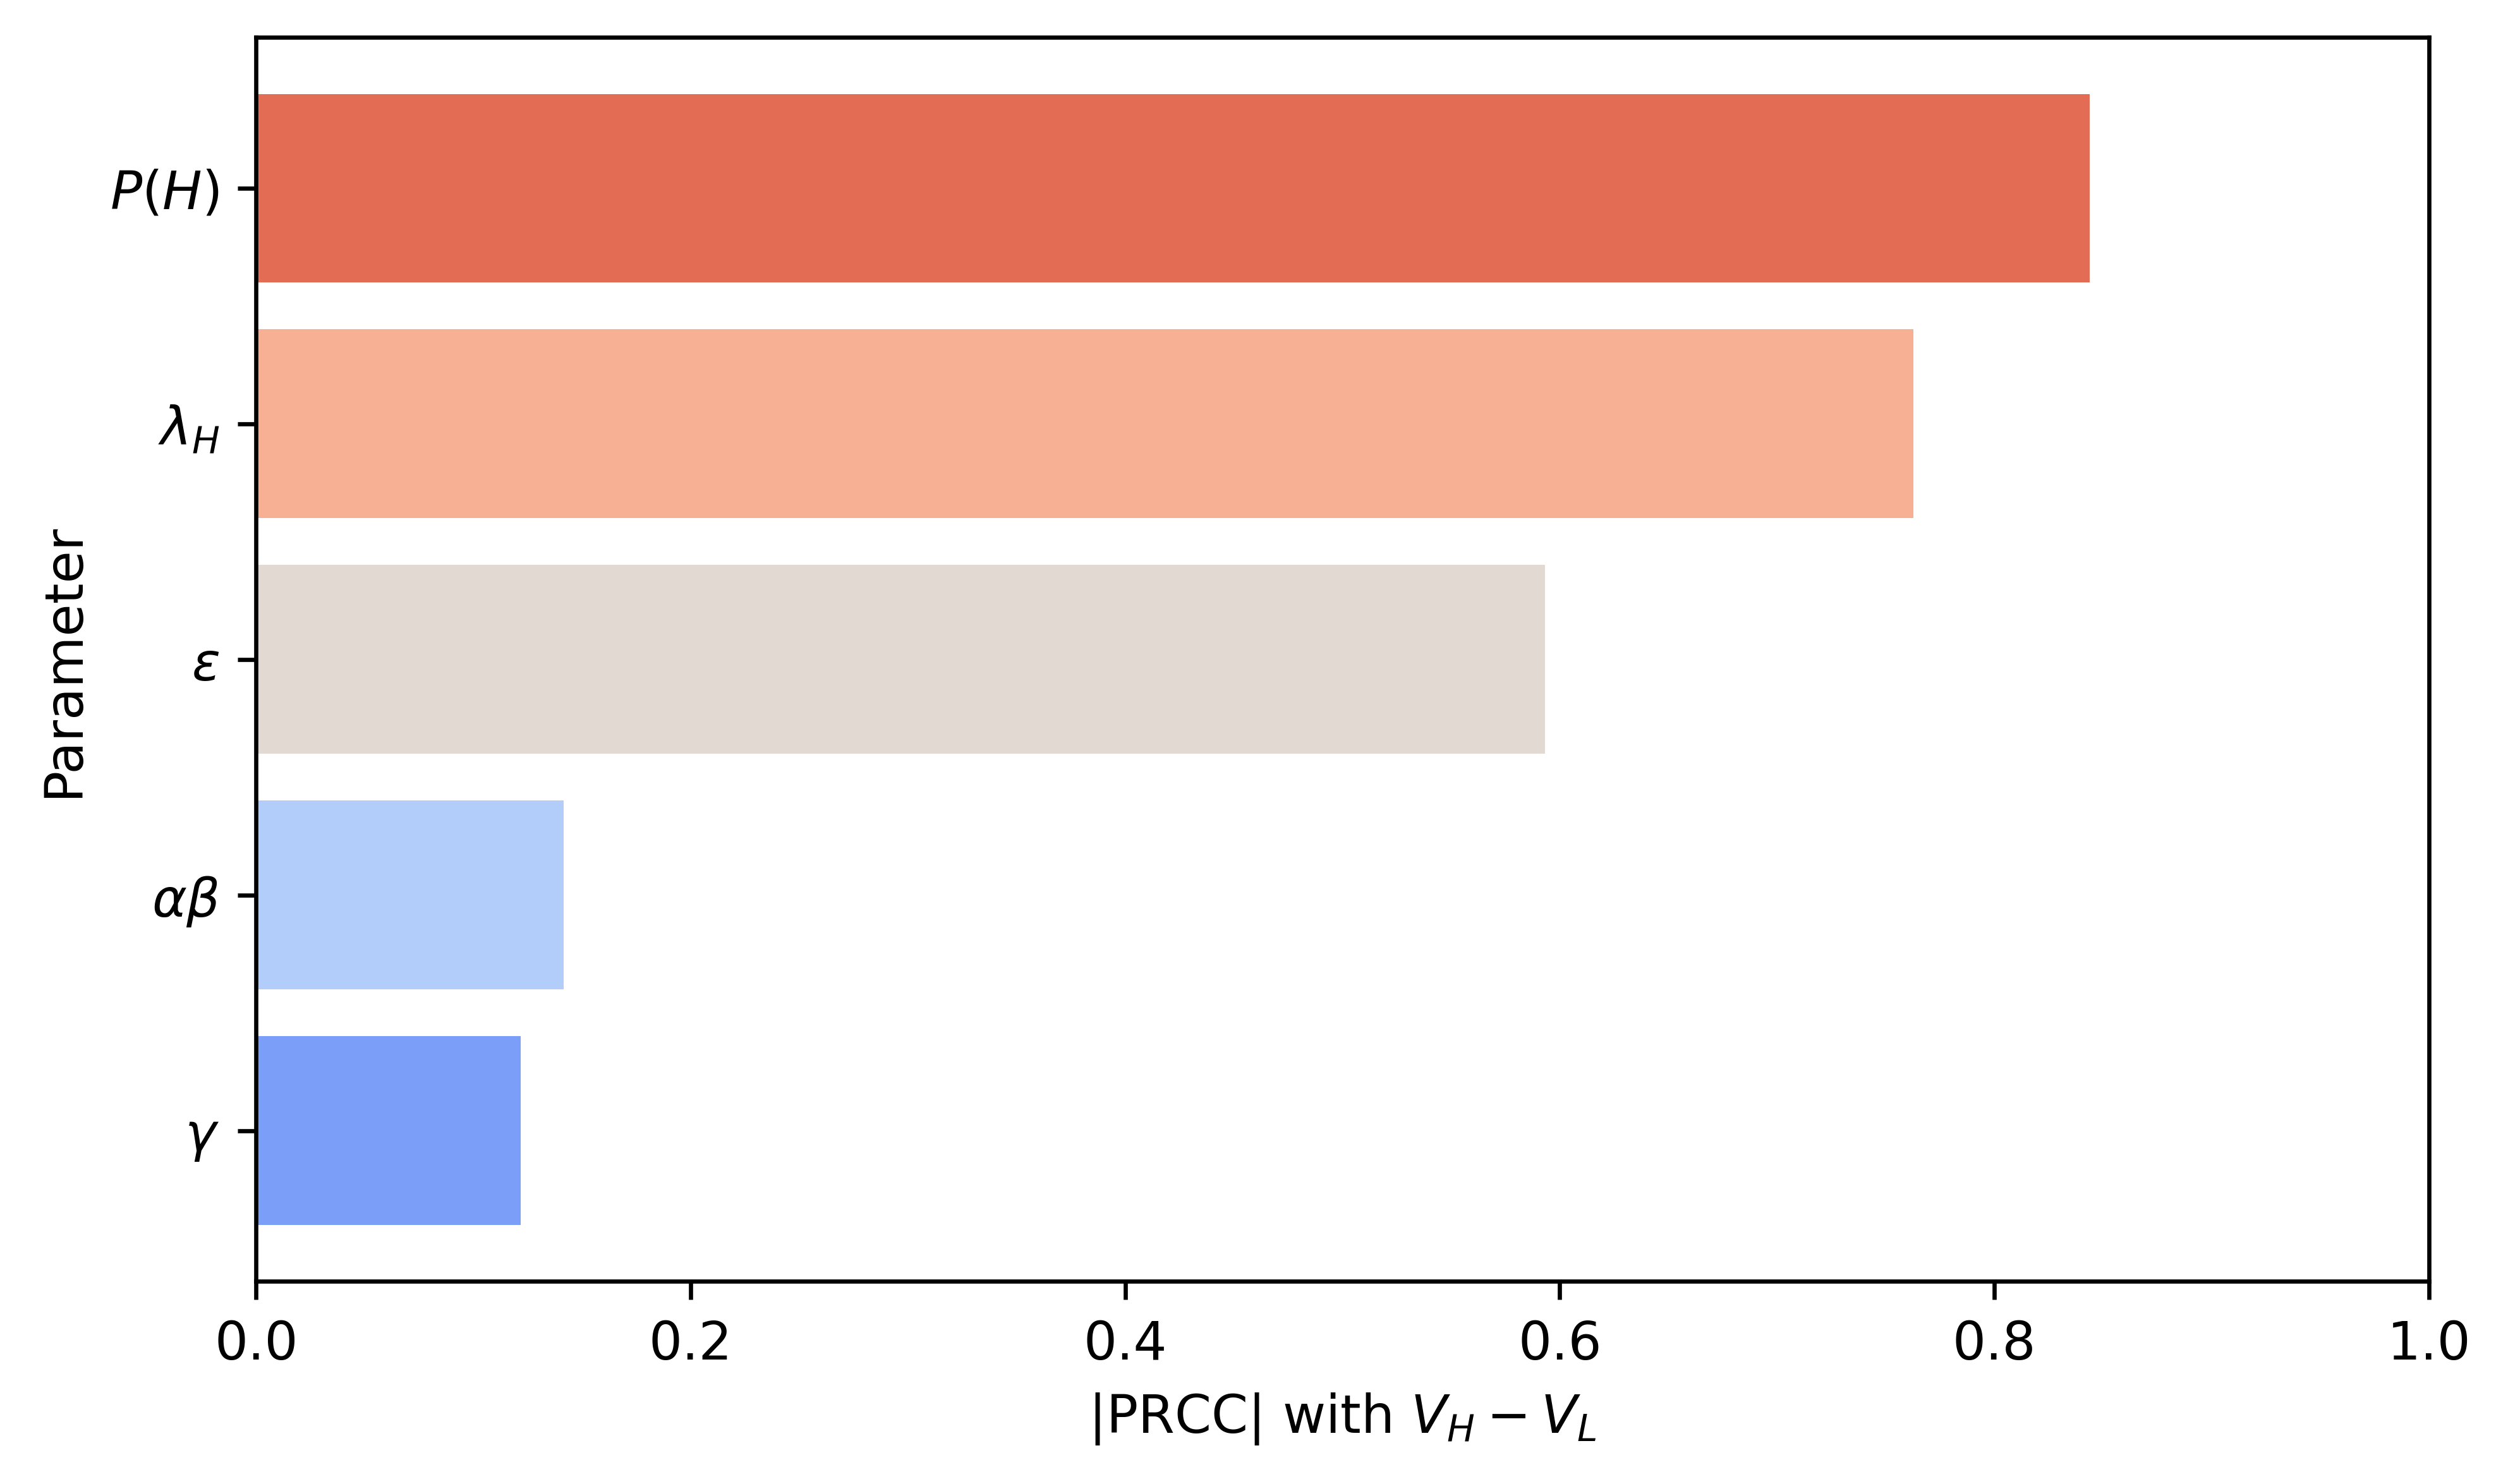
Finally, the global sensitivity analysis shows which model parameters drive the model outcome, \(V_H-V_L\), most strongly (Figure 5). High-reward food availability (\(P(H)\)) had the largest influence on the outcome, followed by the reward value of high-reward foods (\(\lambda_H\)), the dieting probability (\(\varepsilon\)), the effective learning rate (\(\alpha\beta\)), and the extinction rate (\(\gamma\)). These results indicate that differences in environmental exposure to high-reward foods are the dominant driver of reinforcement learning outcomes in a prevention setting, with extinction playing a comparatively modest role.
2: Interventions - Dieting and food availability
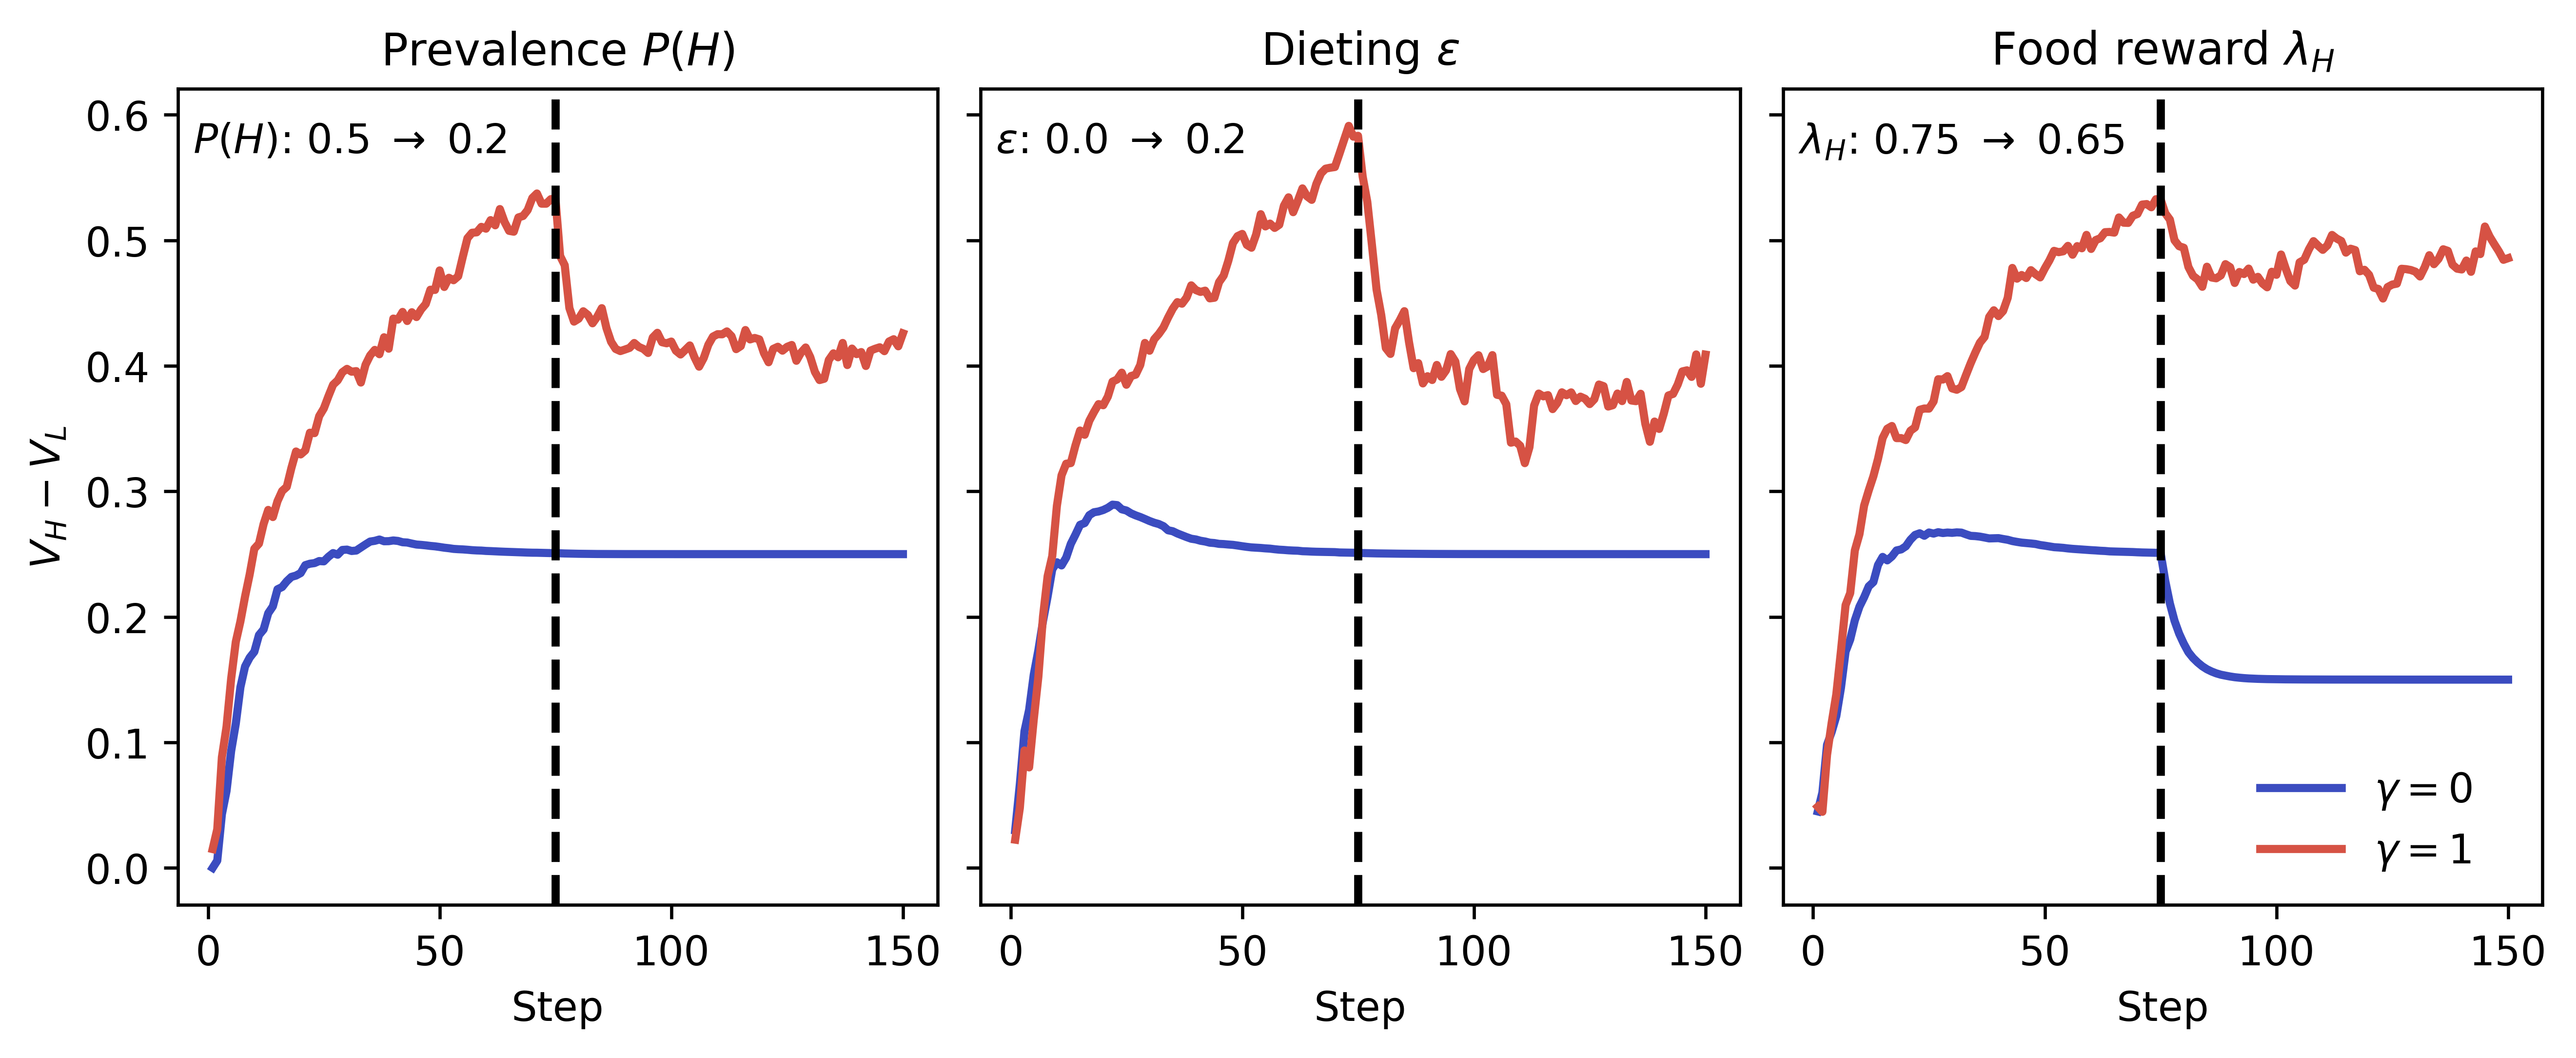
Although extinction contributes relatively little as a model parameter in the prevention scenario, its role in the model becomes more clear in intervention scenarios. In Figure 6, we show three example \(V_H-V_L\) trajectories after intervening in the food environment by reducing the availability of high-reward foods (\(P(H)\)), at the level of the individual by increasing the dieting probability \((\varepsilon)\), and at the level of the food product by reducing the food reward value (\(\lambda_H\)). If there is no extinction (\(\gamma = 0\)), the interventions targeting the availability of high-reward foods and the dieting probability do not alter \(V_H-V_L = 0.25\) as the expected reward values converge on the assigned reward values \(\lambda_H =0.75\) and \(\lambda_L =0.50\). When the food reward is directly targeted, however, the model will simply converge on the new food reward value \(V_H-V_L = 0.15\) because \(\lambda_H =0.65\) and \(\lambda_L =0.50\). With extinction (\(\gamma = 1\)), on the other hand, interventions targeting the availability of high-reward foods and the dieting probability do show a drastic reduction in \(V_H-V_L\) after the moment of implementation. Also for the intervention that reduces the food reward \(V_H-V_L\) changes, but it does not converge on the set reward values \(\lambda_H =0.65\) and \(\lambda_L =0.50\). In short, incorporating extinction allows us to model interventions targeted at the food environment, individual, or both in various ways.
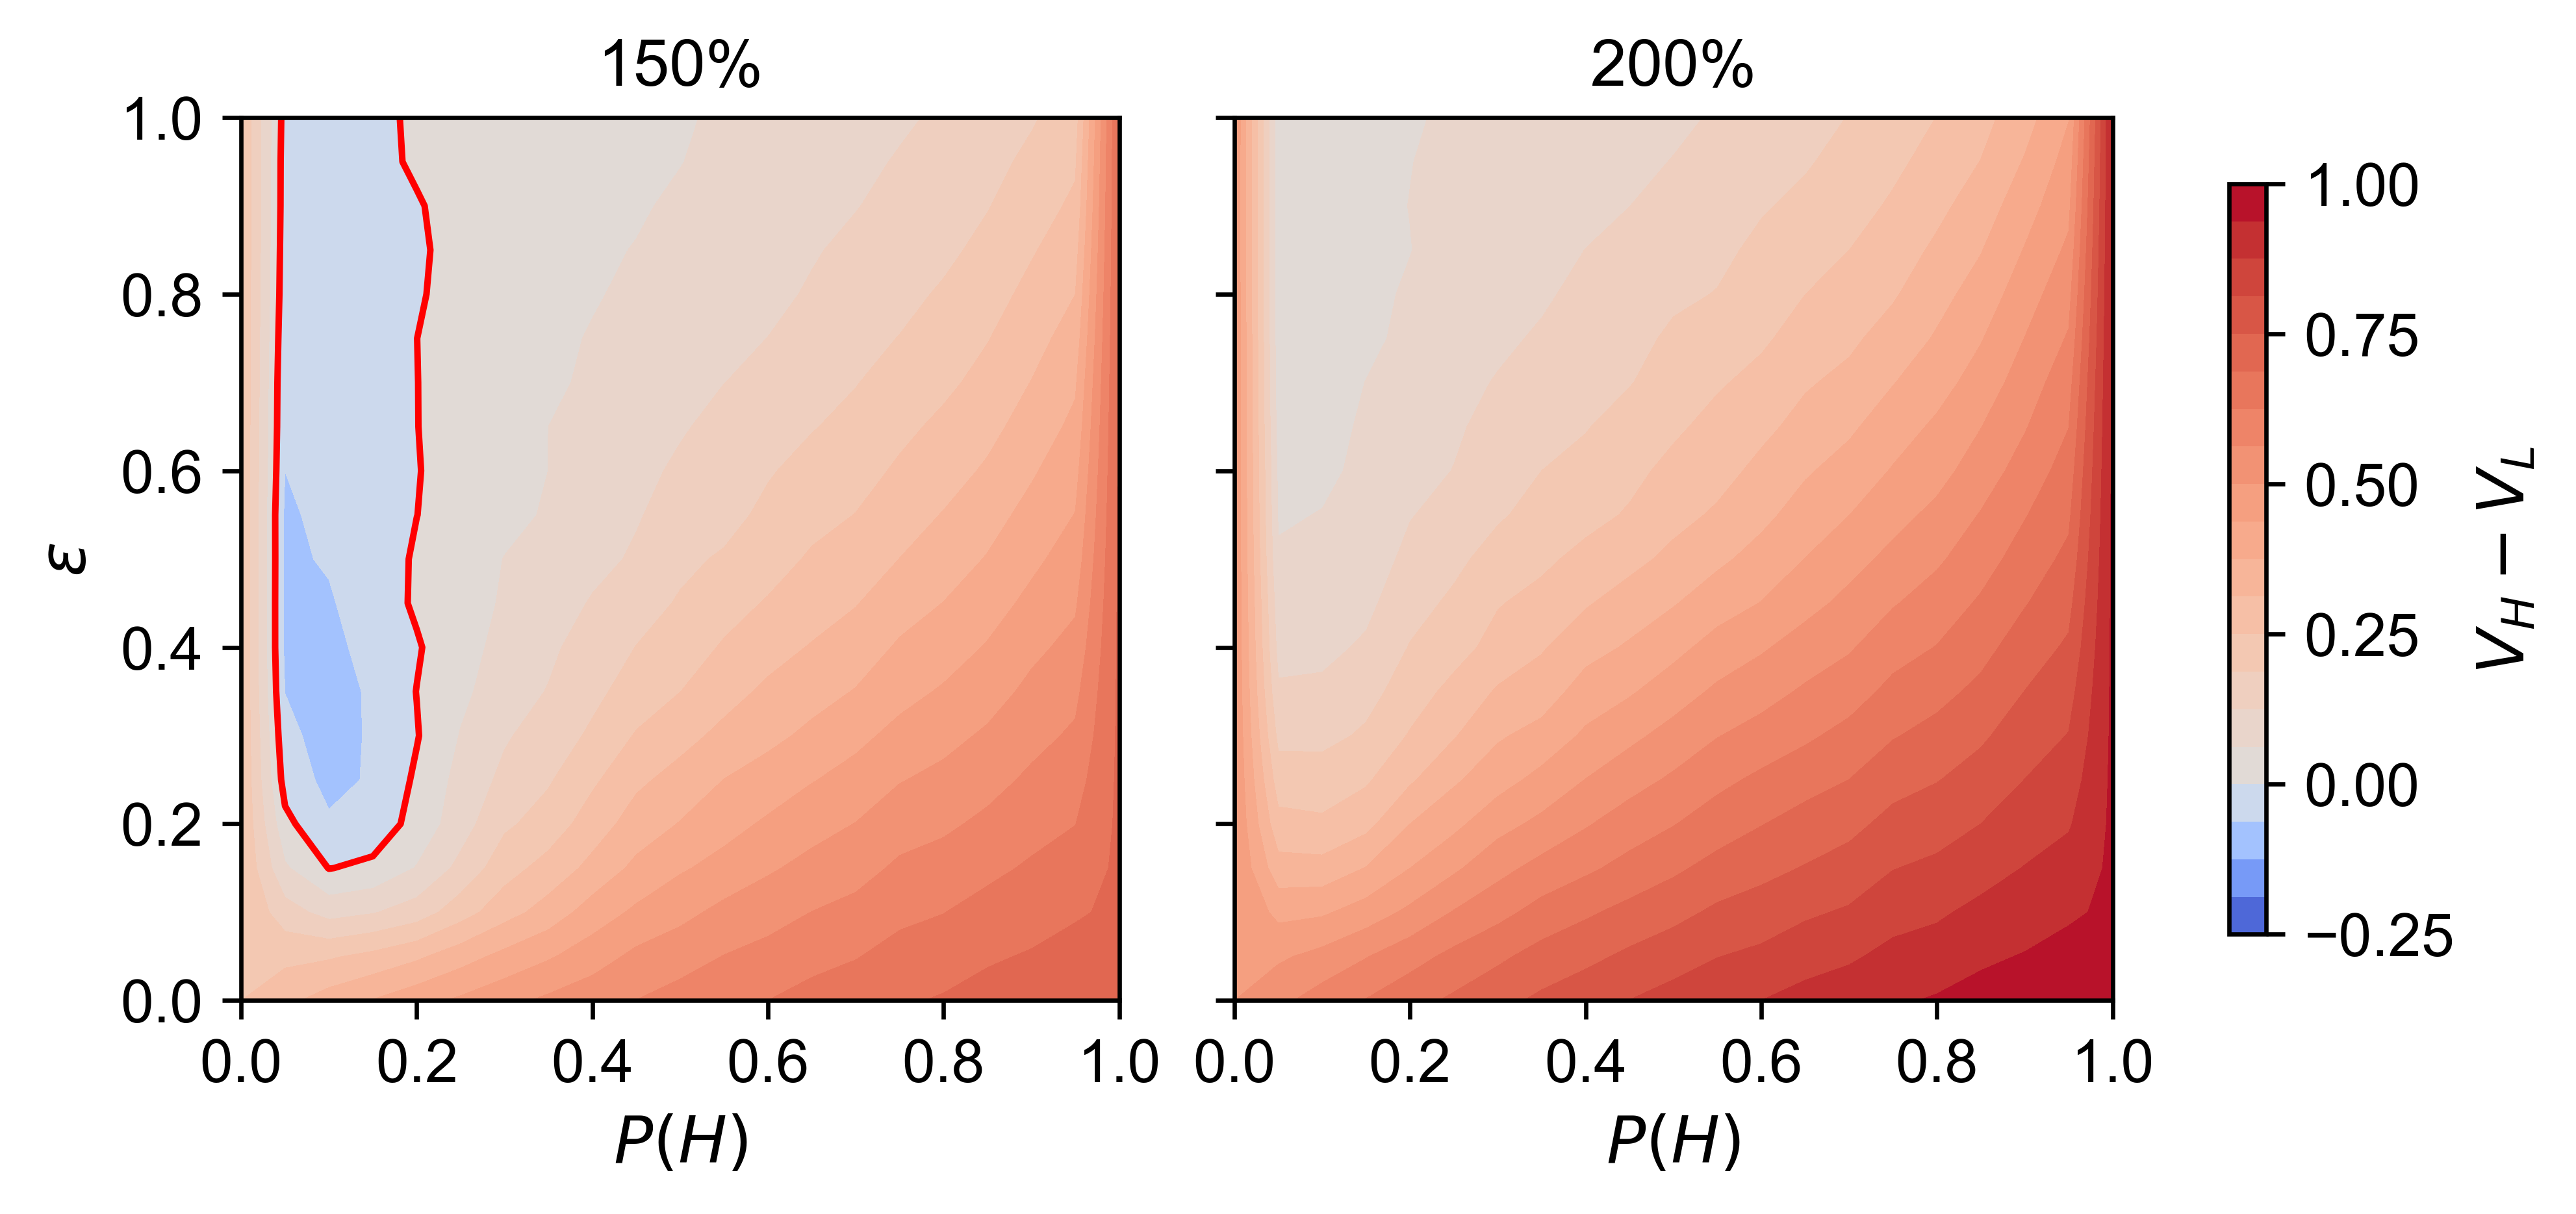
Using the model with extinction, we intervene in the food environment, in the individual, and in both, after a learning phase in a food environment resembling American supermarkets with an availability of 75.9% high-reward foods. In the 150% reward difference scenario, the results show that learning reverses in favor of low-reward foods (\(V_H - V_L \leq 0\)) as indicated by the area within the red contour line (Figure 7). Only by drastically reducing the availability of high-reward foods can learning reverse toward low-reward foods, which cannot be achieved with dieting alone. The largest \(P(H)=0.216\) meaning that at most 21.6% of the food environment should be high-reward foods. A small amount of dieting probability (\(\varepsilon = 0.15\)) is required to start the extinction process and enter the area where learning reverses in favor of the low-reward foods. Similarly, a small amount of high-reward foods is necessary to start the extinction process and enter the area where \(V_H - V_L \leq 0\), with the smallest \(P(H)\) being 0.039. However, in the 200% reward difference scenario, learning did not reverse, and there is no visible area where \(V_H - V_L \leq 0\).
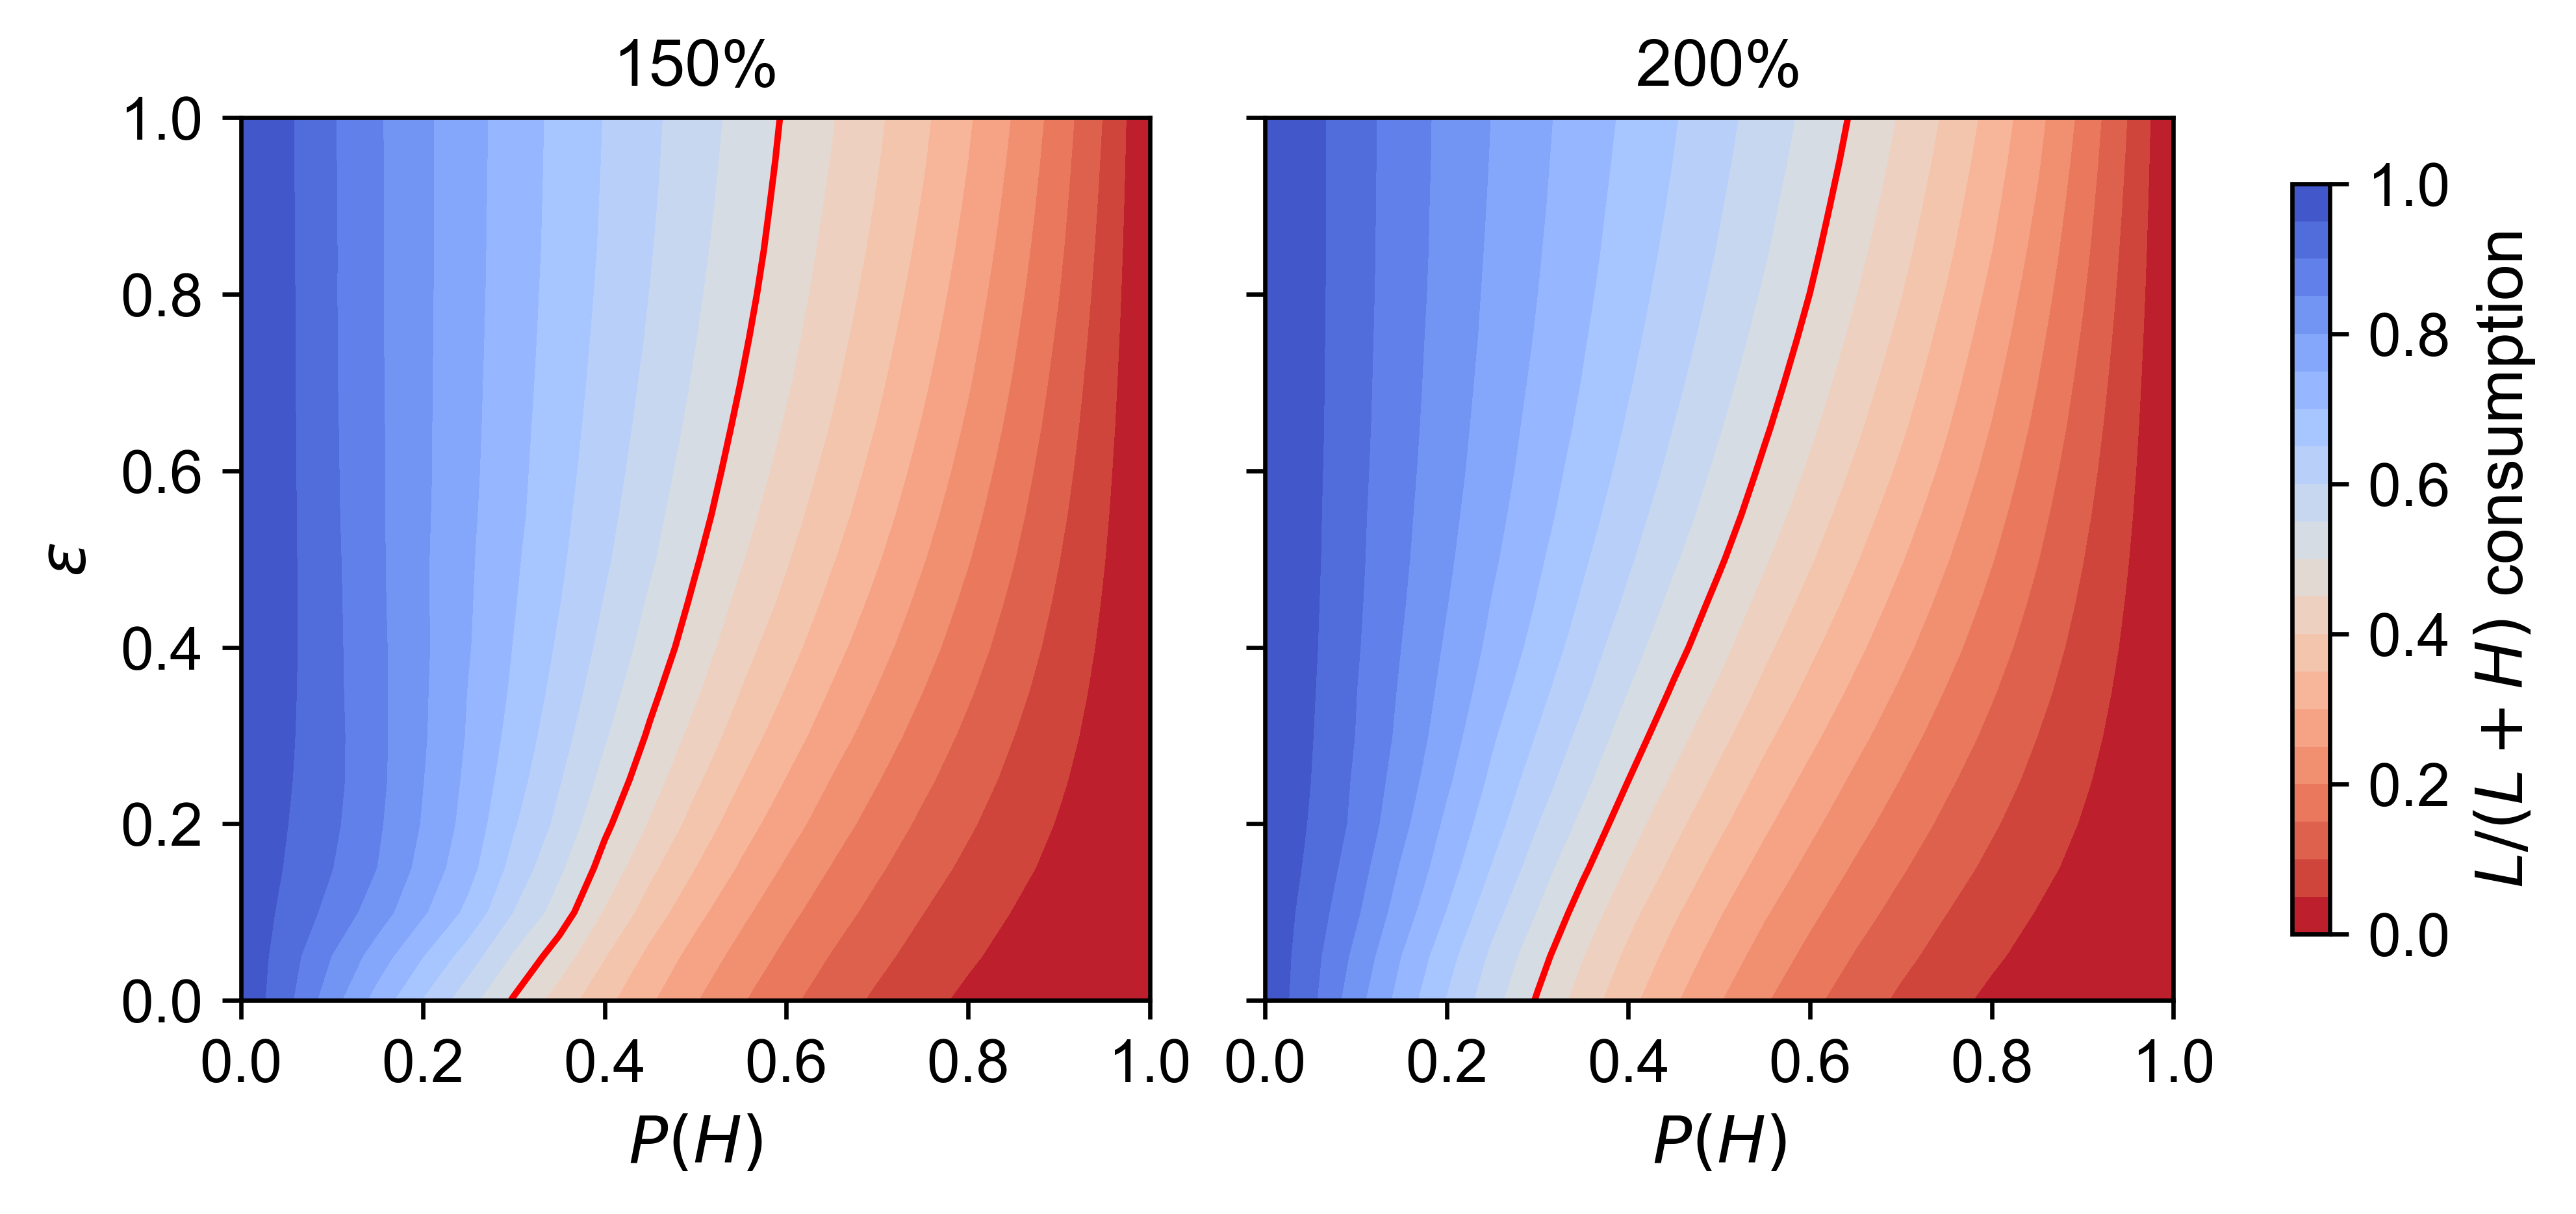
In Figure 8, we see the proportion of consumed low-reward foods after intervening in the food environment by reducing the availability of high-reward foods (\(P(H)\)) and at the level of the individual by increasing the dieting probability (\(\varepsilon\)) for the 150% reward difference scenario. Here, the red line shows where consumption is balanced (\(L/(L+H) = 0.5\)). On the left side of the line, agents consume more low- than high-reward foods. Without dieting (\(\varepsilon = 0\)), the agents consume more low- than high-reward foods at \(P(H)=0.297\) and with dieting (\(\varepsilon = 1\)) at \(P(H)=0.593\). Together these findings suggest that even when learning is not in favor of low-reward foods, if the food environment consists of less than 29.7% high-reward foods, agents still eat more low- than high-reward foods without having to diet.
3: Interventions - Food reward and availability
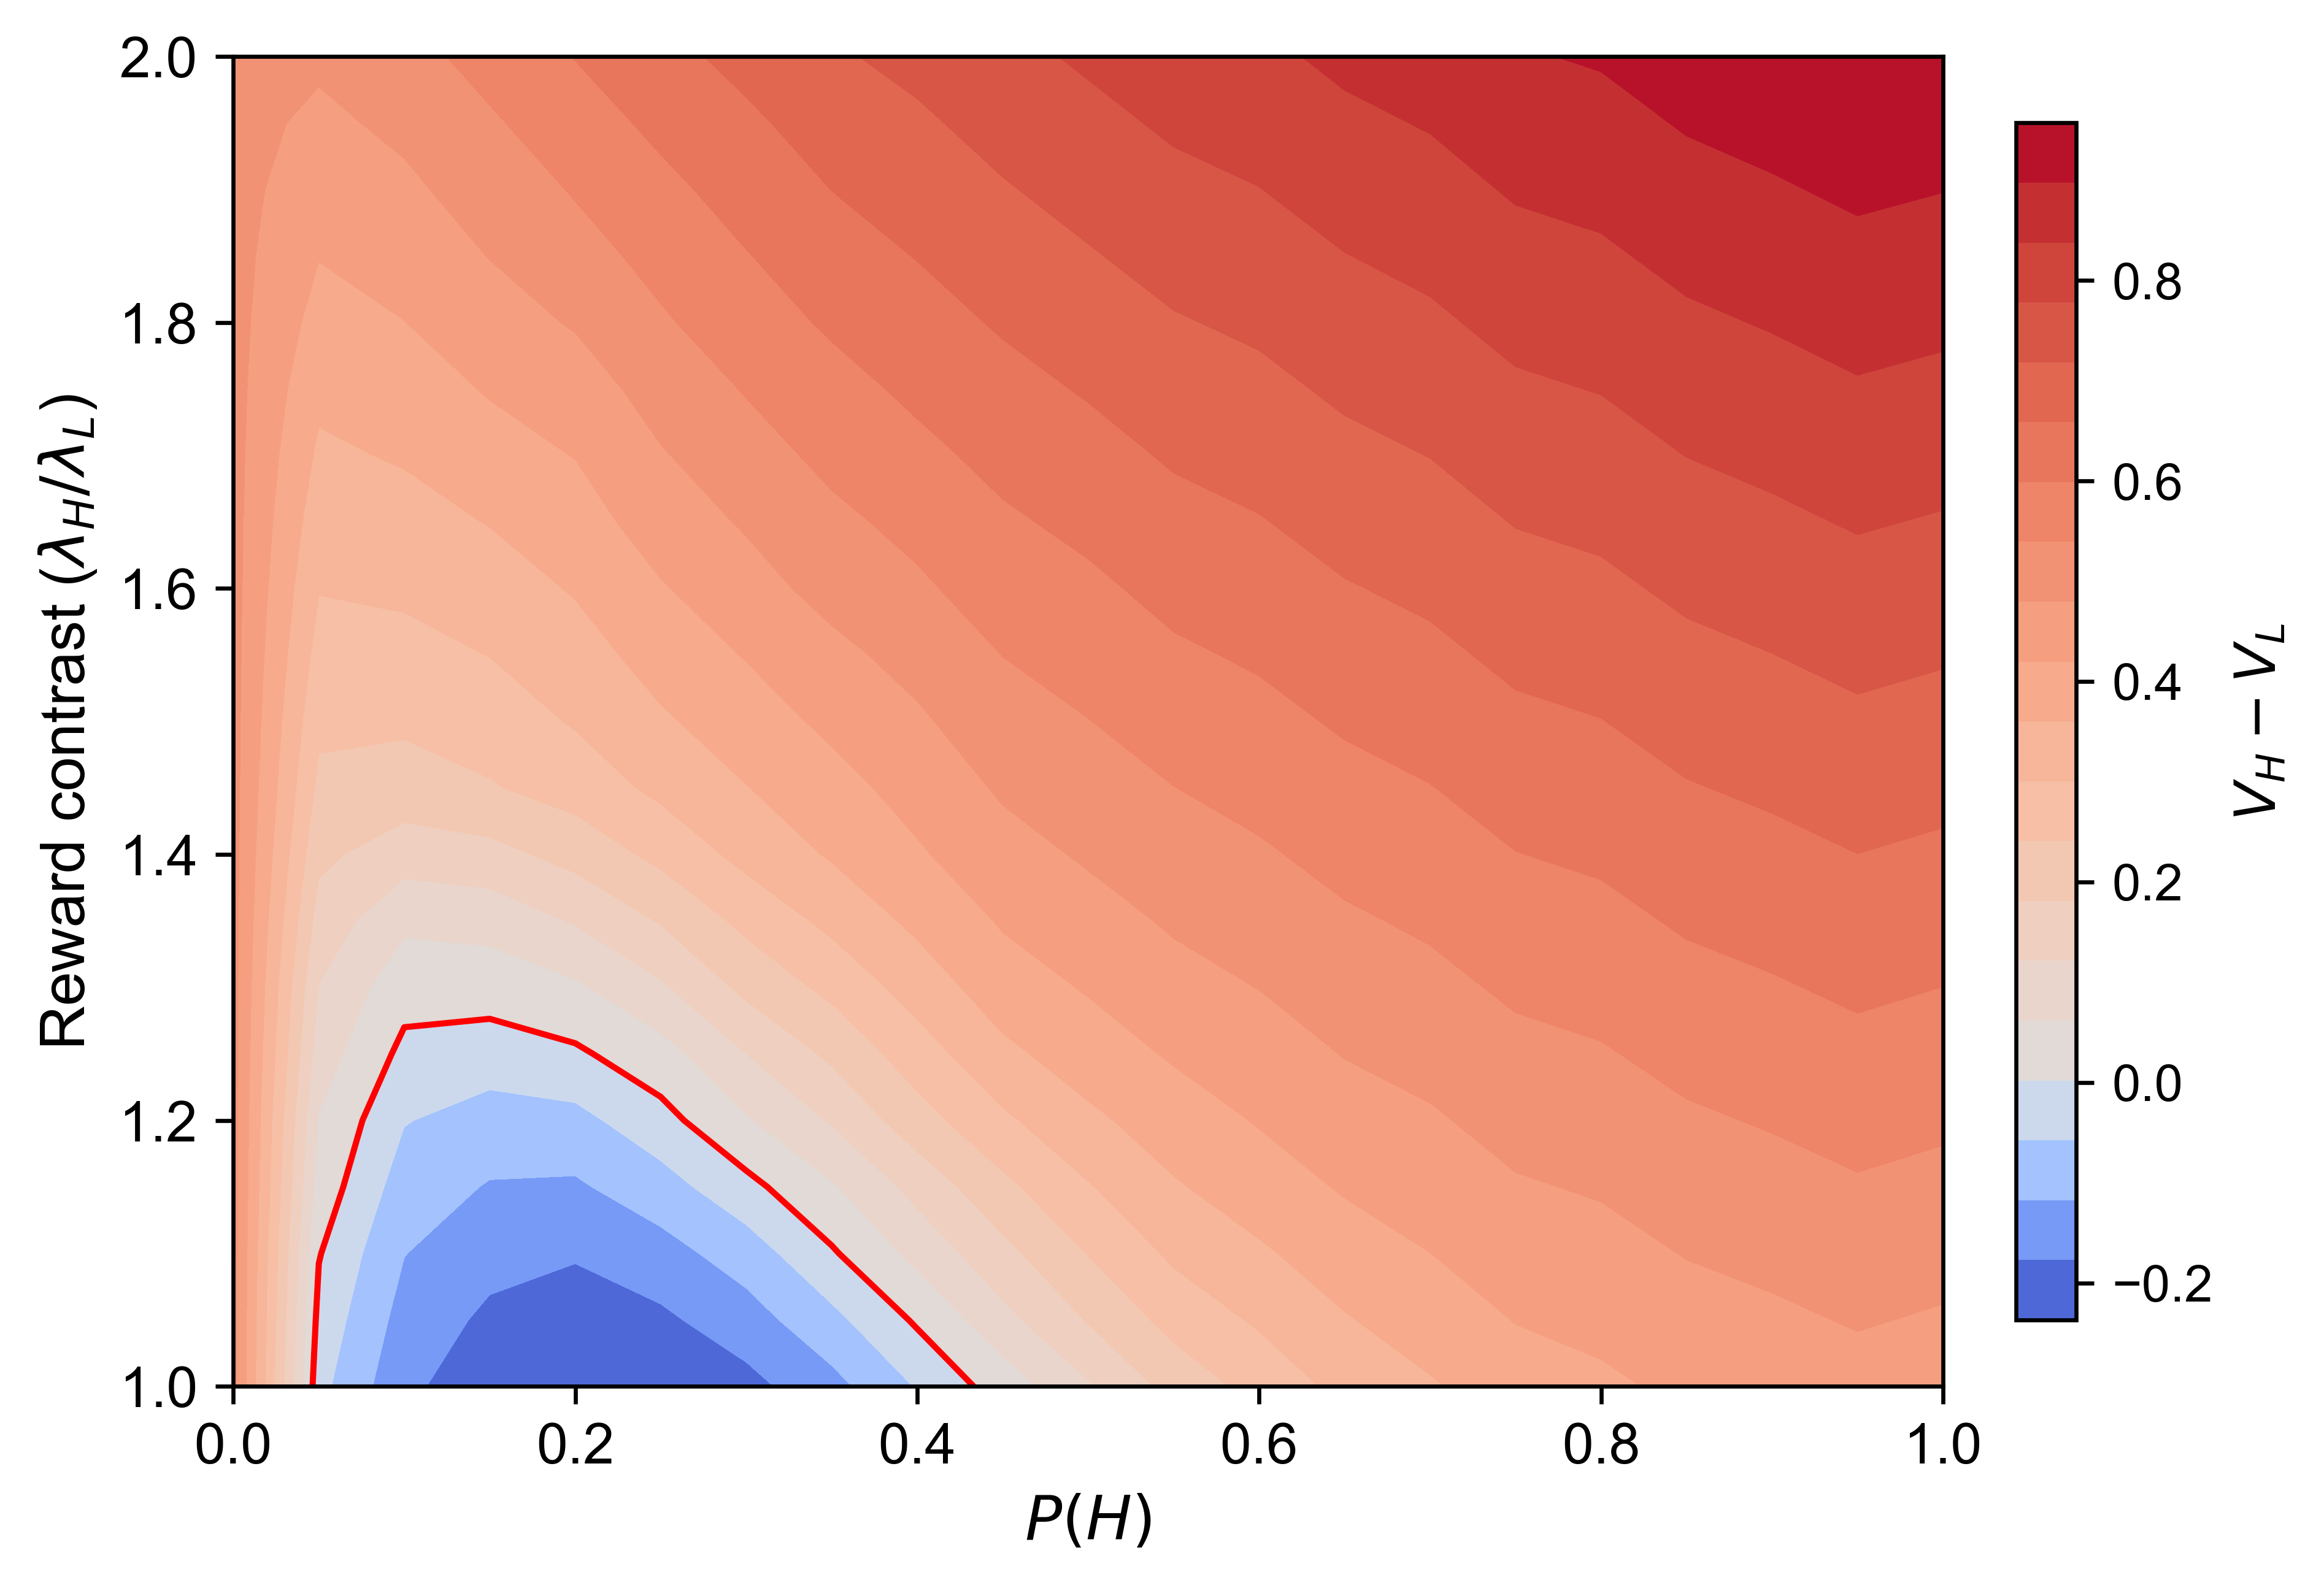
In Figure 9, we see how reinforcement learning for low- and high-reward foods changes after intervening in the food environment by either changing the availability of high-reward foods (\(P(H)\)) or the reward contrast (\(\lambda_H/\lambda_L\)). Again, the red line indicates the transition from high- to low-reward foods in terms of reinforcement learning. To shift reinforcement learning in favor of low-reward foods, a drastic reduction in the availability of high-reward foods paired with lower reward values are required. The maximum availability of high-reward foods is 43.3% (\(P(H) = 0.433\)) but only when the reward value of high-reward foods is made equal to that of the low-reward food (\(\lambda_H/\lambda_L = 1.0\)). The highest reward contrast of the area is 1.25, meaning that the reward value of the high-reward food is at most 25% higher than the low-reward food when the availability of high-reward foods is relatively low.
When reward contrasts between high- and low-reward foods become sufficiently large, reversal of reinforcement learning may no longer be possible. Prior learning under relatively high reward contrasts between \(\lambda_H\) and \(\lambda_L\) leads to irreversibility, such that later changes in the food environment no longer shift reinforcement learning in favor of low-reward foods. In other words, reinforcement learning trajectories are highly sensitive to the magnitude of the reward contrast and the availability of high-reward foods in the food environment when learning.
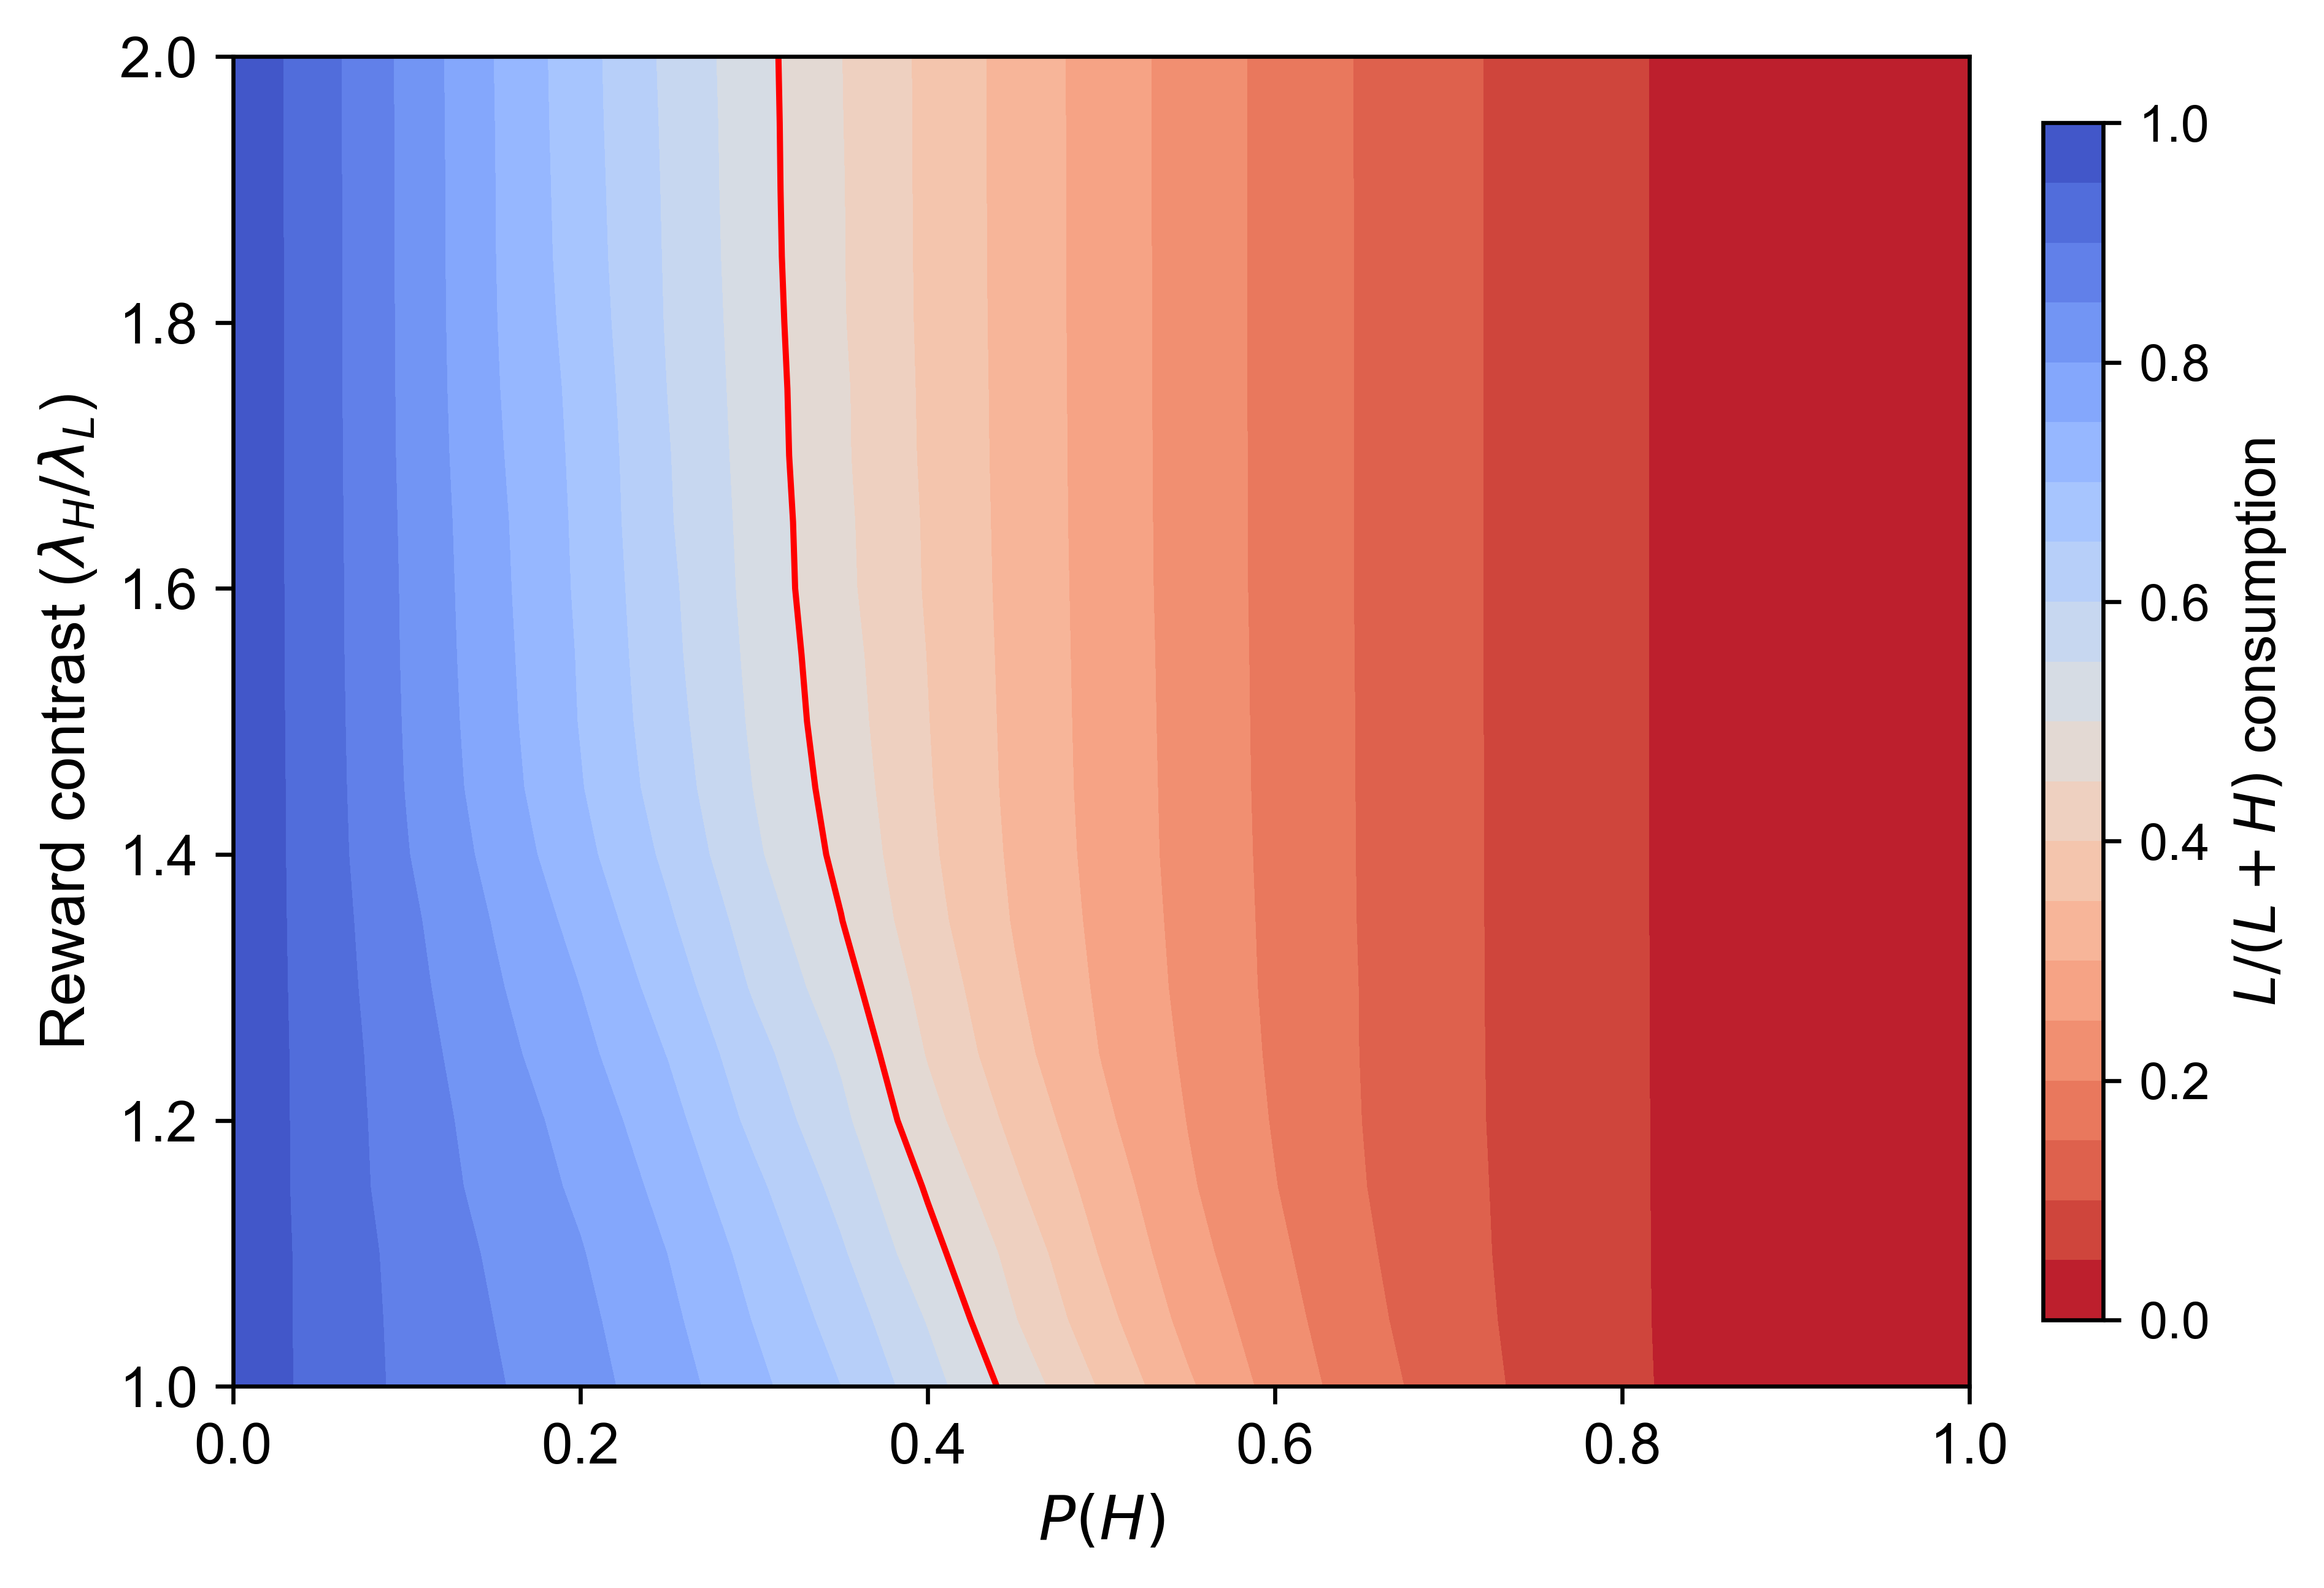
Consumption changes resulting from intervening in the availability of high-reward foods and the reward values of high-reward foods after a learning phase show that a lower availability is required for higher reward contrasts to shift consumption towards low-reward foods. Without changes in the reward contrast \(\lambda_h/\lambda_L = 2.0\), the transition happens at \(P(H) = 0.31\), and with changes in the reward contrast \(\lambda_h/\lambda_L = 1.0\) the shift happens at \(P(H) = 0.439\). These findings suggest that even when learning is not in favor of low-reward foods, if the food environment consists of less than 31% high-reward foods, agents still eat more low- than high-reward foods without having to change the reward value of high-reward foods.
Discussion
The aim of this study was to simulate extinction and its impact on food reinforcement learning following interventions targeting the individual, the food environment, or both. Without extinction, models may fail to predict changes in food reinforcement learning when foods are encountered but not consumed. We simulated several prevention and intervention scenarios. For instance, a child growing up in a food environment with limited access to ultra-processed foods (prevention). In this scenario, we found that when ultra-processed foods are more rewarding than less processed foods, a balanced food environment is insufficient to shift learning in favor of the latter. When ultra-processed foods are abundant in the food environment, including extinction widens the gap in learning between ultra-processed and less processed foods in favor of the former. In the next scenario, we considered a person who has already learned that ultra-processed foods are more rewarding and starts dieting or moves to a food environment where these foods are less available (first intervention). In this scenario, we found that learning only shifts towards less processed foods when the availability of high-reward foods is greatly reduced, with a small amount of dieting required to start extinction. However, when differences in reward values between less- and ultra-processed foods are too large, learning shows signs of irreversibility. Next, we again simulated a person who has already learned that ultra-processed foods are more rewarding and moves to a food environment where these foods are less available or less rewarding due to sugar taxes (second intervention). Here, we found that learning only shifts toward less processed foods if not just the reward values are reduced but also the availability of high-reward foods. Across all scenarios, learning only shifts toward less processed foods after drastic reductions in the availability of ultra-processed foods in the food environment.
In the prevention scenario, we found that extinction biases food reinforcement learning toward ultra-processed foods when these foods are abundant in the food environment, which may help explain the continued increase in intake of ultra-processed foods over time (Conway et al. 2024; Neri et al. 2022; Steele et al. 2016). Without extinction, learning shifts only in favor of less processed foods when ultra-processed foods are even less available in the food environment compared to the model with extinction. Although extinction may be leveraged to weaken undesirable conditioned responses (Houben & Giesen 2018; Veling et al. 2011), our model shows that extinction may have a counterintuitive side-effect where the gap in learning between less- and ultra-processed foods increases by suppressing learning for less processed foods. In contrast, in food environments where less processed foods are more abundant, extinction may widen the gap in favor of these foods. Furthermore, the model is most sensitive to the availability of high-reward foods in the food environment. Taken together, these findings suggest that, with or without extinction, the availability of ultra-processed foods is the most important driver of food reinforcement learning and has to be drastically reduced to shift learning in favor of less processed foods.
In the intervention scenario that increased the dieting probability and reduced the availability of ultra-processed foods, we found that extinction is undermined by the food environment (Bouton 2011). Without changes to the food environment, dieting cannot shift learning in favor of less processed foods. When ultra-processed foods are substantially more rewarding than less processed foods, learning becomes irreversible, where it can no longer shift in favor of less processed foods, highlighting the importance of prevention. These findings align with studies and other computational models that show that altering the availability of products in the environment helps to improve health beliefs and behaviors (Driessen et al. 2014; Kaan et al. 2026; Kasman et al. 2022; Luke et al. 2017; Pinho et al. 2024).
In the intervention scenario that reduced the reward value of ultra-processed foods and their availability, we again found that extinction is undermined by the food environment. Without changes to the food environment, changes in reward values cannot shift learning in favor of less processed foods. If ultra-processed foods are substantially more rewarding, learning shows signs of irreversibility, again underlining the importance of prevention. Given the abundance of ultra-processed foods in many settings and the growing intake and obesity among toddlers and children, these results highlight a pressing concern, especially as early weight gain is associated with higher body mass index in later life (Conway et al. 2024; Davidou et al. 2020; Hendriksen et al. 2021; Magarey et al. 2003; Mou et al. 2025; Must 2003; Ravandi et al. 2025). Yet, most interventions target only the individual, even in efforts to prevent childhood obesity (Leroux et al. 2013; Nobles et al. 2021).
The parameters most relevant to policy in our model are the availability of ultra-processed foods and their reward value. Availability can be targeted through restrictions on the sale of ultra-processed foods in specific settings, such as school cafeterias, or bans on selling certain products to minors, such as energy drinks. Our findings suggest that such interventions need to be substantial, as learning only shifts toward less processed foods when the availability of ultra-processed foods is drastically reduced, as otherwise extinction suppresses learning for less processed foods. However, completely banning ultra-processed foods is possibly counterproductive because our results suggest that some encounters with ultra-processed foods are necessary to start extinction and reverse learning.
Reward values of ultra-processed foods can be reduced by increasing the relative cost of ultra-processed foods through dedicated taxes such as sugar taxes, or by restructuring and reformulating ultra-processed foods to moderate energy intake and lower energy density (Forde et al. 2025; Forde & de Graaf 2022; Tobias & Hall 2021). Importantly, according to our model, a combination of policies that aim to reduce the availability of ultra-processed foods whilst making them less rewarding helps to reverse learning and consumption. A comprehensive list of policy actions can be found in Scrinis et al. (2025). Due to commercial interests and the low cost of ultra-processed foods, it may be difficult to change the food environment (Hagenaars et al. 2024; Middel et al. 2025; Ravandi et al. 2025), but so is successful long-term diet maintenance (Wing & Hill 2001). Overall, our findings suggest that policies that aim to change behavior should consider structural constraints such as the food environment to address the population health risks associated with increased consumption of ultra-processed foods (Hofmann et al. 2025).
Strengths, limitations, and future research
To our knowledge, this study is one of the first to combine extinction with well-validated reinforcement learning algorithms and reward values grounded in neuroscientific evidence to simulate interventions (DiFeliceantonio et al. 2018; Schultz 2016, 1998; Sutton 1988). We also assigned the availability of ultra-processed foods in the food environment based on a large real-world database of three American supermarkets (Ravandi et al. 2025). The model can easily be used for other countries if the availability of ultra-processed foods is known. Besides addressing our research question related to extinction, the model can guide future data collection, generate new hypotheses, and potentially transfer to other health behaviors where reinforcement learning is relevant, including alcohol use and smoking (Epstein 2008; Sun et al. 2016).
Food reinforcement learning is suggested to shape habitual consumption of ultra-processed foods (Burger 2023; Small & DiFeliceantonio 2019), but food choice may depend on additional factors that fall outside the scope of the current model. Factors such as reward variability, time constraints, pricing, social influences, perceptual processes, physiological states, and eating rate were not modeled (Davis et al. 2024; DiFeliceantonio et al. 2018; Forde et al. 2020; Hall et al. 2014; Hare et al. 2009; Kaan et al. 2025; Plassmann et al. 2010; Weydmann et al. 2024). Iterative extensions could incorporate these elements to broaden explanatory power and add realism. Moreover, future work could more thoroughly assess different policies that map onto the model parameters and consider food environments that are non-randomly distributed. As such, the current model is not intended to be a perfect representation of reality or for case-specific prediction (Epstein 2008; Sun et al. 2016). Instead, its value lies in contributing mechanistic evidence to the evidence base for public health using a complex system approach (Stronks et al. 2025).
Conclusion
This study shows how integrating extinction into a food reinforcement learning model offers new insights into how modern food environments shape learning for ultra-processed foods, and why interventions may struggle to shift learning toward less processed foods. By simulating agents across food environments with varying ultra-processed food availability, we show how extinction can paradoxically bias learning toward ultra-processed foods by suppressing learning opportunities for less processed foods, particularly when ultra-processed foods are abundant. We further show that reversing learning toward less processed foods requires substantial reductions in ultra-processed food availability — to at most 21.6% of the food environment — alongside a small amount of dieting to initiate extinction. Dieting alone is insufficient when ultra-processed foods remain too prevalent. Similarly, reducing the reward value alone is insufficient when ultra-processed foods remain too prevalent. Across all simulations, preventing learning in favor of ultra-processed foods or reversing it toward less processed foods requires drastic reductions in ultra-processed food availability.
Notes
Appendix: ODD+D
Overview
Purpose
I.i.a What is the purpose of the study?
This model studies how food reward values learned by agents change over time, and how this affects their eating decisions. It is used to understand how extinction affects food reinforcement learning in various food environments, particularly following interventions targeting 1) the individual via dieting, or 2) the food environment via reducing availability of ultra-processed foods and/or their reward values.
I.i.b For whom is the model designed?
The model is designed for scientists and for policy makers.
Entities, State Variables, and Scales
I.ii.a What kinds of entities are in the model?
The model has individual agents and food types on grid cells.
I.ii.b By what attributes are these entities characterized?
Agents: ID \(i\), position \((x_i,y_i)\) and learned food reward values \(V_{H,i}\) and \(V_{L,i}\).
Food types: each cell has two food objects which are classified as two high-reward foods (\(HH\)), low-reward foods (\(LL\)), or both (\(HL\)).
I.ii.c What are the exogenous factors/drivers?
Main drivers are the proportion of high-reward food objects \(P(H)\) in the food environment, food reward values \(\lambda_H\) and \(\lambda_L\), and the dieting probability \(\epsilon\).
I.ii.d How is space included?
Agents move on an abstract 2D grid in the \(x\) direction resembling the food environment.
I.ii.e Temporal and spatial resolutions and extents
One time step represents one eating decision cycle. Runs use 100 steps, and the grid size is \(100\times100\).
Process Overview and Scheduling
I.iii.a What entity does what, and in what order?
At each time step, all agents update synchronously:
- The agent moves one step in the food environment.
- The agent encounters either two less processed foods, two ultra-processed foods, or one of each.
- The agent chooses and consumes one of the available foods.
- The agent experiences the reward associated with the consumed food.
- The expected reward value of the consumed food is updated.
- In HL cells, extinction is applied to the non-consumed food.
- Repeat.
Design Concepts
Theoretical and Empirical Background
II.i.a General concepts/theories
The model uses reinforcement learning with extinction formalized by the Rescorla-Wagner model.
II.i.b Assumptions behind decision model
Agents have bounded rationality and are myopic. They use only current food reward values and current local context.
II.i.c Why this decision model?
The reinforcement learning model phenomenologically models nutrient signaling from the gut to the brain that is associated with dopamine release and the experience of reward (Small & DiFeliceantonio 2019).
II.i.d If based on data, where does data come from?
The food environment was parameterized using a dataset of three American supermarkets to assign the availability of UPFs (Ravandi et al. 2025). Moreover, the reward values of UPFs were assigned based on findings from nutritional neuroscience (DiFeliceantonio et al. 2018).
II.i.e At which aggregation level were data available?
At the food category level and supermarket level.
Individual Decision Making
II.ii.a Subjects and objects of decision-making
Each agent makes its own food choice. The decision object is high vs. low reward foods when both are available.
II.ii.b Basic rationality/objective
Agents usually pick the food option with higher expected food reward value.
II.ii.c How do agents make decisions?
Agents made decisions based on expected reward values for low-reward (\(V_L\)) and high-reward foods (\(V_H\)). In cells containing only LL or HH foods, choice was deterministic. In mixed HL cells, the probability of eating the low-reward food at time \(t\) with dieting probability \(\varepsilon\) was:
| \[e_t(L) = \begin{cases} 1-\varepsilon & \text{if $V_L > V_H$}, \\ \varepsilon & \text{if $V_L < V_H$}, \\ 0.5 & \text{if $V_L = V_H$}, \end{cases}\] | \[(6)\] |
II.ii.d Adaptation to changing variables
Yes. Choices change over time because \(V_H\) and \(V_L\) are updated based on consumption experiences.
II.ii.e Role of social norms/cultural values
NA.
II.ii.f Role of spatial aspects in decisions
Only local cell type.
II.ii.g Role of temporal aspects in decisions
Past learning determines expected food reward values.
II.ii.h Uncertainty in decision rules
Uncertainty is included through random selection when learned food reward values are equal or depending on dieting probability \(\varepsilon\).
Learning
II.iii.a Individual learning
Each step updates \(V_H\) and \(V_L\).
II.iii.b Collective learning
NA.
Individual Sensing
II.iv.a Endogenous/exogenous variables sensed
Agents sense available food objects and their own learned reward values for each food object.
II.iv.b Which variables of others are perceived?
NA.
II.iv.c Spatial scale of sensing
Local cell only.
II.iv.d Information acquisition mechanism
Agents sense information when on local cell.
II.iv.e Costs for cognition/information gathering
NA.
Individual Prediction
II.v.a–c Prediction of future conditions
Agents predict the reward values of the foods they encounter in each cell using reinforcement learning.
Interaction
II.vi.a Direct or indirect interactions
NA.
II.vi.b On what do interactions depend?
NA.
II.vi.c Communication representation
NA.
II.vi.d Coordination network
NA.
Collectives
II.vii.a–b Collectives and representation
NA.
Heterogeneity
II.viii.a Agent heterogeneity in state/processes
Differences in learning may arise from randomness in the food environment.
II.viii.b Heterogeneity in decision-making
Agents share the same rules and parameters.
Stochasticity
II.ix.a Random processes
Randomness enters through food environment construction where food objects are randomly allocated to cells. Some randomness arises from decisions when learned food reward values are equal and from the dieting probability parameter \(\varepsilon\).
Observation
II.x.a Data collected and when
For each run, the model stores final mean \(V_H\), final mean \(V_L\), and the proportion of consumed L foods (\(L/(L+H)\)). Optional time series can be recorded every step.
II.x.b Key emergent outcomes
Key outcomes are the \(V_H\) - \(V_L\) gap and the proportion of consumed L foods (\(L/(L+H)\)).
Details
Implementation Details
III.i.a How has the model been implemented?
The core model is implemented in Python with NumPy in vector_model.py. Analysis scripts include extinction.py, intervention.py, reward_intervention.py, and extinction_intervention.py. A Mesa version is available in mesa_model. Multiprocessing is used for batch runs.
III.i.b Is the model accessible and where?
Available at GitHub
Initialization
III.ii.a Initial state at \(t=0\)
At initialization there are 100 agents on a 100$$100 grid. Each agent \(i\) starts at \(x_i=0\) and \(y_i=i\). Each cell in the grid contains 2 food objects, totaling 20,000 food objects. The availability of high-reward foods is determined by \(P(H)\) and low-reward foods by \(1-P(H)\). Each cell randomly draws twice from the total availability of food objects and gets classified into \(HH\), \(HL\), or \(LL\) cells. The difference in reward values \(\lambda_H\) and \(\lambda_L\) is either set to 150% or 200%. At the start of each simulation agents have no prior learning \(V_{H,i}=V_{L,i}=0.0\) unless stated otherwise.
III.ii.b Fixed or varying initialization across runs?
Initialization is allowed to vary among simulation experiments. See table of parameters.
III.ii.c Are initial values arbitrary or data-based?
In some experiments, the reward values are informed by empirical findings, namely that reward values of ultra-processed foods rich in fats and sugars are typically 150%-200% higher than less processed foods (DiFeliceantonio et al. 2018). Moreover, the food environment was configured using a database of three American supermarkets showing that ultra-processed foods comprise 75.9% of the food availability (Ravandi et al. 2025).
Input Data
III.iii.a External time-varying input data
NA.
Submodels
III.iv.a Detailed submodels
When a food was consumed, the expected reward value of that food updated according to:
| \[\Delta V = \alpha \beta (\lambda - V)\] | \[(7)\] |
where \(\alpha \in [0,1]\) is the learning rate governing how strongly prediction errors update expected reward values, \(\beta \in [0,1]\) scales the impact of the experienced reward on learning, \(\lambda \in [0,1]\) is the experienced reward after eating, and \(V \in [0,1]\) is the current expected reward value. The product \(\alpha\beta\) determines the effective learning rate. The term \((\lambda - V)\) represents the prediction error, and \(\Delta V\) denotes the change in expected reward value.
Extinction occurred when a food was available but not consumed (HL cells). In this case, \(\lambda = 0\), and learning was scaled by the extinction rate \(\gamma\):
| \[\Delta V = \alpha \beta \gamma (\lambda - V), \quad \lambda = 0\] | \[(8)\] |
so that
| \[\Delta V = -\alpha \beta \gamma V\] | \[(9)\] |
III.iv.b Model parameters, dimensions, reference values
| Parameter | Description | 1 | 2 | 3 | ||
| Learning | Intervention | Learning | Intervention | |||
| Agents | Number of agents | 100 | 100 | 100 | 100 | 100 |
| Time steps | Duration of run | 100 | 100 | 100 | 100 | 100 |
| Replicates | Number of runs | 20 | 20 | 20 | 20 | 20 |
| \( \alpha\beta \) | Effective learning rate | 0.3 | 0.3 | 0.3 | 0.3 | 0.3 |
| \( \gamma \) | Extinction rate | 0–1 | 1 | 1 | 1 | 1 |
| \( \lambda_H \) | Reward value high-reward food | 0.75, 1.0 | 0.75, 1.0 | 0.75, 1.0 | 0.75, 1.0 | 0.5–1.0 |
| \( \lambda_L \) | Reward value low-reward food | 0.5 | 0.5 | 0.5 | 0.5 | 0.5 |
| \( P(H) \) | Prevalence H in food environment | 0.0–1.0 | 0.759 | 0.0–1.0 | 0.759 | 0.0–1.0 |
| \( \varepsilon \) | Dieting probability | 0 | 0 | 0–1 | 0 | 0.05 |
III.iv.c Submodel design/parameterization/testing
The reinforcement learning model phenomenologically models nutrient signaling from the gut to the brain that is associated with dopamine release and the experience of reward (Small & DiFeliceantonio 2019). In some experiments, the reward values are informed by empirical findings, namely reward values of ultra-processed foods that are rich in fats and sugars are typically 150%-200% higher than less processed foods (DiFeliceantonio et al. 2018). Moreover, the food environment was configured using a database of three American supermarkets showing that ultra-processed foods comprise 75.9% of the food availability (Ravandi et al. 2025).
References
AKKER, K. van den, Schyns, G., & Jansen, A. (2017). Altered appetitive conditioning in overweight and obese women. Behaviour Research and Therapy, 99, 78–88.
AMBIKAPATHI, R., Schneider, K. R., Davis, B., Herrero, M., Winters, P., & Fanzo, J. C. (2022). Global food systems transitions have enabled affordable diets but had less favourable outcomes for nutrition, environmental health, inclusion and equity. Nature Food, 3(9), 764–779. [doi:10.1038/s43016-022-00588-7]
ASTRUP, A., Monteiro, C. A., & Ludwig, D. S. (2022). Does the concept of “ultra-processed foods” help inform dietary guidelines, beyond conventional classification systems? NO. American Journal of Clinical Nutrition, 116(6), 1482–1488. [doi:10.1093/ajcn/nqac123]
BERRIDGE, K. C., & Robinson, T. E. (1998). What is the role of dopamine in reward: Hedonic impact, reward learning, or incentive salience? Brain Research Reviews, 28(3), 309–369. [doi:10.1016/s0165-0173(98)00019-8]
BOUTON, M. E. (2011). Learning and the persistence of appetite: Extinction and the motivation to eat and overeat. Physiology and Behavior, 103(1), 51–58. [doi:10.1016/j.physbeh.2010.11.025]
BURGER, K. S. (2017). Frontostriatal and behavioral adaptations to daily sugar-sweetened beverage intake: A randomized controlled trial. American Journal of Clinical Nutrition, 105(3), 555–563. [doi:10.3945/ajcn.116.140145]
BURGER, K. S. (2023). Food reinforcement architecture: A framework for impulsive and compulsive overeating and food abuse. Obesity, 31(7), 1734–1744. [doi:10.1002/oby.23792]
CONWAY, R. E., Heuchan, G. N., Heggie, L., Rauber, F., Lowry, N., Hallen, H., & Llewellyn, C. H. (2024). Ultra-processed food intake in toddlerhood and mid-childhood in the UK: Cross sectional and longitudinal perspectives. European Journal of Nutrition. [doi:10.31219/osf.io/pyw9m]
DAVIDOU, S., Christodoulou, A., Fardet, A., & Frank, K. (2020). The holistico-reductionist Siga classification according to the degree of food processing: An evaluation of ultra-processed foods in French supermarkets. Food & Function, 11(3), 2026–2039. [doi:10.1039/c9fo02271f]
DAVIS, N., Dermody, B., Koetse, M., & Voorn, G. van. (2024). Identifying personal and social drivers of dietary patterns: An agent-based model of dutch consumer behavior. Journal of Artificial Societies and Social Simulation, 27(1), 4. [doi:10.18564/jasss.5020]
DE Araujo, I. E., Lin, T., Veldhuizen, M. G., & Small, D. M. (2013). Metabolic regulation of brain response to food cues. Current Biology, 23(10), 878–883.
DIFELICEANTONIO, A. G., Coppin, G., Rigoux, L., Edwin Thanarajah, S., Dagher, A., Tittgemeyer, M., & Small, D. M. (2018). Supra-additive effects of combining fat and carbohydrate on food reward. Cell Metabolism, 28(1), 33–44. [doi:10.1016/j.cmet.2018.05.018]
DRIESSEN, C. E., Cameron, A. J., Thornton, L. E., Lai, S. K., & Barnett, L. M. (2014). Effect of changes to the school food environment on eating behaviours and/or body weight in children: A systematic review. Obesity Reviews, 15(12), 968–982. [doi:10.1111/obr.12224]
EPSTEIN, J. M. (2008). Why model? Journal of Artificial Societies and Social Simulation, 11(4), 12.
FARDET, A., & Rock, E. (2020). Ultra-processed foods and food system sustainability: What are the links? Sustainability (Switzerland), 12(15). [doi:10.3390/su12156280]
FERRIDAY, D., & Brunstrom, J. M. (2011). I just can’t help myself: Effects of food-cue exposure in overweight and lean individuals. International Journal of Obesity, 35(1), 142–149. [doi:10.1038/ijo.2010.117]
FORDE, C. G., & de Graaf, K. (2022). Influence of sensory properties in moderating eating behaviors and food intake. Frontiers in Nutrition, 9(2). [doi:10.3389/fnut.2022.841444]
FORDE, C. G., Heuven, L. A. J., Bruinessen, M. van, Liu, Z., Stieger, M., Graaf, K. de, & Lasschuijt, M. P. (2025). Eating rate has sustained effects on energy intake from ultra-processed diets: A two-week ad libitum dietary randomized controlled cross-over trial. The American Journal of Clinical Nutrition, 123(4), 101122. [doi:10.1016/j.ajcnut.2025.11.012]
FORDE, C. G., Mars, M., & Graaf, K. de. (2020). Ultra-Processing or Oral Processing? A Role for Energy Density and Eating Rate in Moderating Energy Intake from Processed Foods. Current Developments in Nutrition, 4(3), nzaa019. [doi:10.1093/cdn/nzaa019]
GEARHARDT, A. N., & DiFeliceantonio, A. G. (2023). Highly processed foods can be considered addictive substances based on established scientific criteria. Addiction, 118(4), 589–598. [doi:10.1111/add.16065]
HAGENAARS, L. L., Schmidt, L. A., Groeniger, J. O., Bekker, M. P. M., Ellen, F. ter, Leeuw, E. de, van Lenthe, F. J., Oude Hengel, K. M., & Stronks, K. (2024). Why we struggle to make progress in obesity prevention and how we might overcome policy inertia: Lessons from the complexity and political sciences. Obesity Reviews, 25(5). [doi:10.1111/obr.13705]
HALL, K. D., Ayuketah, A., Brychta, R., Cai, H., Cassimatis, T., Chen, K. Y., Chung, S. T., Costa, E., Courville, A., Darcey, V., Fletcher, L. A., Forde, C. G., Gharib, A. M., Guo, J., Howard, R., Joseph, P. V., McGehee, S., Ouwerkerk, R., Raisinger, K., … Zhou, M. (2019). Ultra-processed diets cause excess calorie intake and weight gain: An inpatient randomized controlled trial of ad libitum food intake. Cell Metabolism, 30(1), 67–77. [doi:10.1016/j.cmet.2019.05.008]
HALL, K. D., Hammond, R. A., & Rahmandad, H. (2014). Dynamic interplay among homeostatic, hedonic, and cognitive feedback circuits regulating body weight. American Journal of Public Health, 104(7), 1169–1175. [doi:10.2105/ajph.2014.301931]
HAMMOND, R. A., Ornstein, J. T., Fellows, L. K., Dubé, L., Levitan, R., & Dagher, A. (2012). A model of food reward learning with dynamic reward exposure. Frontiers in Computational Neuroscience, 6(SEPTEMBER). [doi:10.3389/fncom.2012.00082]
HARE, T. A., Camerer, C. F., & Rangel, A. (2009). Self-Control in Decision-Making Involves Modulation of the vmPFC Valuation System. Science, 324(5927), 646–648. [doi:10.1126/science.1168450]
HENDRIKSEN, A., Jansen, R., DIjkstra, S. C., Huitink, M., Seidell, J. C., & Poelman, M. P. (2021). How healthy and processed are foods and drinks promoted in supermarket sales flyers? A cross-sectional study in the Netherlands. Public Health Nutrition, 24(10), 3000–3008. [doi:10.1017/s1368980021001233]
HOFMANN, W., Betsch, C., Böhm, R., Ridder, D. de, Drews, S., Ewert, B., Hertwig, R., Sniehotta, F. F., & Mata, J. (2025). Rethinking behaviour change interventions in policymaking. Nature Human Behaviour, 9(9), 1765–1767. [doi:10.1038/s41562-025-02284-5]
HOUBEN, K., & Giesen, J. C. A. H. (2018). Will work less for food: Go/No-Go training decreases the reinforcing value of high-caloric food. Appetite, 130, 79–83. [doi:10.1016/j.appet.2018.08.002]
JANSEN, A., Stegerman, S., Roefs, A., Nederkoorn, C., & Havermans, R. (2010). Decreased salivation to food cues in formerly obese successful dieters. Psychotherapy and Psychosomatics, 79(4), 257–258. [doi:10.1159/000315131]
JOZEFOWIEZ, J. (2018). Associative versus predictive processes in Pavlovian conditioning. Behavioural Processes, 154, 21–26. [doi:10.1016/j.beproc.2017.12.016]
JUUL, F., Martinez-Steele, E., Parekh, N., & Monteiro, C. A. (2025). The role of ultra-processed food in obesity. Nature Reviews Endocrinology, 21(11), 672–685. [doi:10.1038/s41574-025-01143-7]
KAAN, J., & Kleef, E. van. (2024). Decoupling of desire and salivation over repeated chocolate consumption and the moderating role of food legalizing. Biological Psychology, 192. [doi:10.1016/j.biopsycho.2024.108846]
KAAN, J., Kunz, S., Moore, S., & Khaluf, Y. (2026). Lack of group-to-individual generalizability in pseudocontingencies. Scientific Reports, 16, 10459. [doi:10.1038/s41598-026-41585-1]
KAAN, J., Ulug, C., Thompson, K., Khaluf, Y., Wagemakers, A., & Moore, S. (2025). Health in All Networks Simulator: Mixed-methods protocol to test social network interventions for resilience, health and well-being of adults in Amsterdam. BMJ open, 15(4), e100703. [doi:10.1136/bmjopen-2025-100703]
KASMAN, M., Hammond, R. A., Purcell, R., Heuberger, B., Moore, T. R., Grummon, A. H., Wu, A. J., Block, J. P., Hivert, M. F., Oken, E., & Kleinman, K. (2022). An agent-based model of child sugar-sweetened beverage consumption: Implications for policies and practices. American Journal of Clinical Nutrition, 116(4), 1019–1029. [doi:10.1093/ajcn/nqac194]
KING, B. M. (2013). The modern obesity epidemic, ancestral hunter-gatherers, and the sensory/reward control of food intake. American Psychologist, e077310. [doi:10.1037/a0030684]
LANE, M. M., Gamage, E., Du, S., Ashtree, D. N., McGuinness, A. J., Gauci, S., Baker, P., Lawrence, M., Rebholz, C. M., Srour, B., Touvier, M., Jacka, F. N., O’Neil, A., Segasby, T., & Marx, W. (2024). Ultra-processed food exposure and adverse health outcomes: Umbrella review of epidemiological meta-analyses. BMJ, e077310. [doi:10.1136/bmj-2023-077310]
LANGELLIER, B. A., Stankov, I., Hammond, R. A., Bilal, U., Auchincloss, A. H., Barrientos-Gutierrez, T., De Oliveira Cardoso, L., & Diez Roux, A. V. (2022). Potential impacts of policies to reduce purchasing of ultra-processed foods in Mexico at different stages of the social transition: an agent-based modelling approach. Public Health Nutrition, 25(6), 1711–1719. [doi:10.1017/s1368980021004833]
LEROUX, J. S., Moore, S., & Dubé, L. (2013). Beyond the "i" in the obesity epidemic: A review of social relational and network interventions on obesity. Journal of Obesity, 2013. [doi:10.1155/2013/348249]
LUKE, D. A., Hammond, R. A., Combs, T., Sorg, A., Kasman, M., MacK-Crane, A., Ribisl, K. M., & Henriksen, L. (2017). Tobacco town: Computational modeling of policy options to reduce tobacco retailer density. American Journal of Public Health, 107(5), 740–746. [doi:10.2105/ajph.2017.303685]
MAGAREY, A. M., Daniels, L. A., Boulton, T. J., & Cockington, R. A. (2003). Predicting obesity in early adulthood from childhood and parental obesity. International Journal of Obesity, 27(4), 505–513. [doi:10.1038/sj.ijo.0802251]
MARINO, S., Hogue, I. B., Ray, C. J., & Kirschner, D. E. (2008). A methodology for performing global uncertainty and sensitivity analysis in systems biology. Journal of Theoretical Biology, 254(1), 178–196. [doi:10.1016/j.jtbi.2008.04.011]
MENDOZA, K., Smith-Warner, S. A., Rossato, S. L., Khandpur, N., Manson, J. E., Qi, L., Rimm, E. B., Mukamal, K. J., Willett, W. C., Wang, M., Hu, F. B., Mattei, J., & Sun, Q. (2024). Ultra-processed foods and cardiovascular disease: analysis of three large US prospective cohorts and a systematic review and meta-analysis of prospective cohort studies. The Lancet Regional Health - Americas, 37, 100859. [doi:10.1016/j.lana.2024.100859]
MIDDEL, C. N. H., Colizzi, C., Waterlander, W., Dijkstra, S. C., Beulens, J. W. J., & Mackenbach, J. D. (2025). Causal loop diagramming the dynamics that shape food environments in dutch supermarkets. BMC Medicine, 23(1). [doi:10.1186/s12916-025-04360-z]
MONTEIRO, C. A., Astrup, A., & Ludwig, D. S. (2022). Does the concept of “ultra-processed foods” help inform dietary guidelines, beyond conventional classification systems? YES. The American Journal of Clinical Nutrition, 116(6), 1476–1481. [doi:10.1093/ajcn/nqac122]
MONTEIRO, C. A., Louzada, M. L., Steele-Martinez, E., Cannon, G., Andrade, G. C., Baker, P., Bes-Rastrollo, M., Bonaccio, M., Gearhardt, A. N., Khandpur, N., Kolby, M., Levy, R. B., Machado, P. P., Moubarac, J.-C., Rezende, L. F. M., Rivera, J. A., Scrinis, G., Srour, B., Swinburn, B., & Touvier, M. (2025). Ultra-processed foods and human health: The main thesis and the evidence. The Lancet, 406(10520), 2667–2684. [doi:10.1016/s0140-6736(25)01565-x]
MONTEIRO, C. A., Moubarac, J. C., Cannon, G., Ng, S. W., & Popkin, B. (2013). Ultra‐processed products are becoming dominant in the global food system. Obesity Reviews, 14(S2), 21–28. [doi:10.1111/obr.12107]
MOU, Y., Santos, S., Lara, M., Derks, I. P. M., Jaddoe, V. W. V., Gaillard, R., Felix, J. F., Steegers, E., Voortman, T., van Ijzendoorn, M. H., & Jansen, P. W. (2025). Identifying key predictors of mid-childhood obesity in a population-based cohort study: An evidence synthesis and predictive modeling study. Obesity Reviews, 26(11). [doi:10.1111/obr.13958]
MUST, A. (2003). Does overweight in childhood have an impact on adult health? Nutrition Reviews, 61(4), 139–142.
MÜLLER, B., Bohn, F., Dreßler, G., Groeneveld, J., Klassert, C., Martin, R., Schlüter, M., Schulze, J., Weise, H., & Schwarz, N. (2013). Describing human decisions in agent-based models - ODD+D, an extension of the ODD protocol. Environmental Modelling and Software, 48, 37–48.
NERI, D., Steele, E. M., Khandpur, N., Cediel, G., Zapata, M. E., Rauber, F., Marrón-Ponce, J. A., Machado, P., Costa Louzada, M. L. da, Andrade, G. C., Batis, C., Babio, N., Salas-Salvadó, J., Millett, C., Monteiro, C. A., & Levy, R. B. (2022). Ultraprocessed food consumption and dietary nutrient profiles associated with obesity: A multicountry study of children and adolescents. Obesity Reviews, 23(S1). [doi:10.1111/obr.13387]
NOBLES, J., Summerbell, C., Brown, T., Jago, R., & Moore, T. (2021). A secondary analysis of the childhood obesity prevention Cochrane Review through a wider determinants of health lens: Implications for research funders, researchers, policymakers and practitioners. International Journal of Behavioral Nutrition and Physical Activity, 18(1). [doi:10.21203/rs.3.rs-58885/v3]
PAQUET, C., Daniel, M., Knäuper, B., Gauvin, L., Kestens, Y., & Dubé, L. (2010). Interactive effects of reward sensitivity and residential fast-food restaurant exposure on fast-food consumption. American Journal of Clinical Nutrition, 91(3), 771–776. [doi:10.3945/ajcn.2009.28648]
PAQUET, C., Portella, A. K., Moore, S., Ma, Y., Dagher, A., Meaney, M. J., Kennedy, J. L., Levitan, R. D., Silveira, P. P., & Dube, L. (2021). Dopamine D4 receptor gene polymorphism (DRD4 VNTR) moderates real-world behavioural response to the food retail environment in children. BMC Public Health, 21(1). [doi:10.1186/s12889-021-10160-w]
PELLEGRINI, B., Strootman, L. X., Fryganas, C., Martini, D., & Fogliano, V. (2025). Home-made vs industry-made: Nutrient composition and content of potentially harmful compounds of different food products. Current Research in Food Science, 10. [doi:10.1016/j.crfs.2024.100958]
PINHO, M. G. M., Koop, Y., Mackenbach, J. D., Lakerveld, J., Simões, M., Vermeulen, R., Wagtendonk, A. J., Vaartjes, I., & Beulens, J. W. J. (2024). Time-varying exposure to food retailers and cardiovascular disease hospitalization and mortality in the netherlands: A nationwide prospective cohort study. BMC Medicine, 22(1), 427. [doi:10.1186/s12916-024-03648-w]
PLASSMANN, H., O’Doherty, J. P., & Rangel, A. (2010). Appetitive and aversive goal values are encoded in the medial orbitofrontal cortex at the time of decision making. Journal of Neuroscience, 30(32), 10799–10808. [doi:10.1523/jneurosci.0788-10.2010]
RAVANDI, B., Ispirova, G., Sebek, M., Mehler, P., Barabási, A. L., & Menichetti, G. (2025). Prevalence of processed foods in major US grocery stores. Nature Food, 6(3), 296–308. [doi:10.1038/s43016-024-01095-7]
RESCORLA, R. A., & Wagner, A. R. (1972). A theory of Pavlovian conditioning: Variations in the effectiveness of reinforcement and nonreinforcement. In A. H. Black & W. F. Prokasy (Eds.),Classical Conditioning II: Current Research and Theory, vol. 2, (pp. 64–99). New York, NY: Appleton-Century-Crofts
SAMSON, R. D., Frank, M. J., & Fellous, J.-M. (2010). Computational models of reinforcement learning: the role of dopamine as a reward signal. Cognitive Neurodynamics, 4(2), 91–105. [doi:10.1007/s11571-010-9109-x]
SCHAUDER, S., Thomsen, M. R., & Nayga, R. M. (2020). Agent-based modeling insights into the optimal distribution of the Fresh Fruit and Vegetable Program. Preventive Medicine Reports, 20. [doi:10.1016/j.pmedr.2020.101173]
SCHULTZ, W. (2016). Dopamine reward prediction error coding. Dialogues in Clinical Neuroscience, 18(1), 23–32. [doi:10.31887/dcns.2016.18.1/wschultz]
SCHULTZ, W. (1998). Predictive reward signal of dopamine neurons. Journal of Neurophysiology, 80(1), 1–27. [doi:10.1152/jn.1998.80.1.1]
SCRINIS, G., Popkin, B. M., Corvalan, C., Duran, A. C., Nestle, M., Lawrence, M., Baker, P., Monteiro, C. A., Millett, C., Moubarac, J.-C., Jaime, P., & Khandpur, N. (2025). Policies to halt and reverse the rise in ultra-processed food production, marketing, and consumption. The Lancet, 406(10520), 2685–2702. [doi:10.1016/s0140-6736(25)01566-1]
SMALL, D. M., & DiFeliceantonio, A. G. (2019). Neuroscience: Processed foods and food reward. Science, 363(6425), 346–347. [doi:10.1126/science.aav0556]
STEELE, E. M., Baraldi, L. G., Da Costa Louzada, M. L., Moubarac, J. C., Mozaffarian, D., & Monteiro, C. A. (2016). Ultra-processed foods and added sugars in the US diet: Evidence from a nationally representative cross-sectional study. BMJ Open, 6(3).
STRONKS, K., Rod, M. H., Rutter, H., & Rod, N. H. (2025). Towards a complex systems model of evidence for public health. BMJ Global Health, 10(10). [doi:10.1136/bmjgh-2025-021061]
SUN, Z., Lorscheid, I., Millington, J. D., Lauf, S., Magliocca, N. R., Groeneveld, J., Balbi, S., Nolzen, H., Müller, B., Schulze, J., & Buchmann, C. M. (2016). Simple or complicated agent-based models? A complicated issue. Environmental Modelling and Software, 86, 56–67. [doi:10.1016/j.envsoft.2016.09.006]
SUTTON, R. S. (1988). Learning to predict by the methods of temporal differences. Machine Learning, 3, 9–44. [doi:10.1023/a:1022633531479]
SUTTON, R. S., & Barto, A. G. (1998). Reinforcement Learning: An Introduction. Cambridge, MA: MIT Press.
TOBIAS, D. K., & Hall, K. D. (2021). Eliminate or reformulate ultra-processed foods? Biological mechanisms matter. Cell Metabolism, 33(12), 2314–2315. [doi:10.1016/j.cmet.2021.10.005]
VELDHUIZEN, M. G., Babbs, R. K., Patel, B., Fobbs, W., Kroemer, N. B., Garcia, E., Yeomans, M. R., & Small, D. M. (2017). Integration of sweet taste and metabolism determines carbohydrate reward. Current Biology, 27(16), 2476–2485. [doi:10.1016/j.cub.2017.07.018]
VELING, H., Aarts, H., & Papies, E. K. (2011). Using stop signals to inhibit chronic dieters’ responses toward palatable foods. Behaviour Research and Therapy, 49(11), 771–780. [doi:10.1016/j.brat.2011.08.005]
WEYDMANN, G., Miguel, P. M., Hakim, N., Dubé, L., Silveira, P. P., & Bizarro, L. (2024). How are overweight and obesity associated with reinforcement learning deficits? A systematic review. Appetite, 193. [doi:10.1016/j.appet.2023.107123]
WING, R. R., & Hill, J. O. (2001). Successful weight loss management. Annual Review of Nutrition, 21, 323–341.