Sylvie Huet, Margaret Edwards and Guillaume Deffuant (2007)
Taking into Account the Variations of Neighbourhood Sizes in the Mean-Field Approximation of the Threshold Model on a Random Network
Journal of Artificial Societies and Social Simulation
vol. 10, no. 1
<https://www.jasss.org/10/1/10.html>
For information about citing this article, click here
Received: 30-Jun-2006 Accepted: 27-Sep-2006 Published: 31-Jan-2007
 Abstract
|
|
(1) |
|
|
(2) |
where V(e,A) and V(e,B) are the proportion of neighbours of individual e respectively of behaviour A or B and the gA, gB are parameters of the model.
|
|
(3) |
|
|
(4) |
|
|
(5) |
Note that the mean number of links for one node is z = (N-1)p. Therefore, we can write:

|
(6) |
where the last approximate equality expresses that a binomial law tends to a Poisson distribution when N tends to infinity. Since our simulations involve 10.000 individuals, we shall consider that it is justified to follow this approximation.
|
|
(7) |
|
|
(8) |
|
|
(9) |
where P(A,kA/i) and P(B,kA/i) are the respective probability of: choosing A (respectively B) given the number kA of A neighbours over the neighbourhood size i. For i = 0, the probabilities of behaviour A and B are both equal to 0.5.
|
|
(10) |
|
|
(11) |
|
|
(12) |
|
|
(13) |
|
|
(14) |
|
|
(15) |
|
|
(16) |

|
| Figure 1. Absolute value of difference between attraction basin limit values predicted by the two aggregated models for part of the tested values. We show here the most significant results |
| Table 1: Experimental design for gA, β and average neighbourhood size — values of experimental design for initial proportion of A in the population are obtained as explained in the paragraph above | ||
| Mean size of neighbourhood | gA (behaviour A payoff) | β (level of randomness in decision function) |
| 3 | 0,51 | 7 - 8 - 9 - 10 - 11 - 12 - 13 - 17 - 30 - 25 - 45 - 50 - 60 - 70 - 80 - 90 - 100 - 200 - 300 - 400 - 700 |
| 0,57 | 12 - 16 - 21 - 23 - 35 - 240 - 940 | |
| 5 | 0,55 | 7,6 - 8 - 10 - 12 - 14 - 16 - 20 - 25 - 50 - 60 - 80 - 250 - 500 - 800 - 1200 |
| 0,59 | 8,98 - 10 - 11 - 13 - 15 - 20 - 25 - 60 - 250 - 470 - 620 - 800 - 1200 | |
| 0,6 | 9,46 - 9,6 - 10 - 11 - 12 - 13 - 14 - 15 - 17 - 20 - 25 - 26 - 30 - 32 - 38 - 40 - 50 - 60 - 80 - 100 - 120 - 140 - 160 - 200 - 260 - 300 - 800 - 1200 | |
| 0,61 | 12 - 14 - 16 - 18 - 20 - 23 - 27 - 30 - 40 - 50 - 60 - 70 - 80 - 90 - 100 - 150 - 200 - 300 - 400 - 500 - 600 - 700 - 800 - 1200 | |
| 0,65 | 13,1 - 15 - 16 - 25 - 30 - 40 - 60 - 100 - 800 - 1200 | |
| 0,67 | 14,6 - 18 - 19 - 20 - 22 - 25 - 30 - 35 - 80 - 100 - 230 - 320 - 470 - 650 - 800 - 1200 | |
| 0,7 | 18,1 - 22 - 25 - 27 - 28 - 29 - 30 - 35 - 60 - 110 - 250 - 470 - 800 - 1200 | |
| 8 | 0,66 | 11 - 12 - 13 - 14 - 15 - 16 - 18 - 25 - 40 - 130 - 220 - 320 - 620 |
| 0,67 | 11 - 12 - 13 - 14 - 15 - 16 - 18 - 25 - 40 - 130 - 220 - 320 - 620 | |
| 0,74 | 20 - 21 - 22 - 23 - 24 - 25 - 40 - 130 - 220 - 320 - 620 | |
| 0,75 | 21 - 22 - 23 - 24 - 25 - 27 - 30 - 33 - 36 - 40 - 130 - 220 - 320 - 620 | |
| 0,76 | 21 - 22 - 23 - 24 - 25 - 27 - 30 - 33 - 36 - 40 - 130 - 220 - 320 - 620 | |
| 25 | 0,84 | 31 - 32 - 33 - 35 - 40 - 45 - 50 - 55 - 60 - 65 - 70 - 90 - 110 - 130 - 150 - 170 - 220 - 270 - 320 - 420 - 520 - 620 - 720 |

|
(17) |

|
| Figure 2. Global improvement of our approximation |
|
|
| Figure 3. Three models bifurcations conditions for 5 neighbours on average |

|
| Figure 4. Three models bifurcations conditions for 3 neighbours mean |

|
| Figure 5. Three models bifurcations conditions for 25 neighbours mean |

|
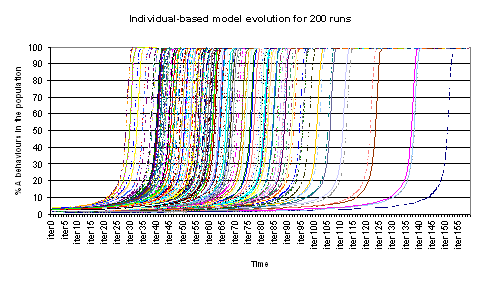
| Figure 6. Evolution of % A behaviours for the variable neighbourhood aggregated model for β = 29, gA=0.7, 5 neighbours and 4% initial A behaviours |

|
| Figure 7a. Evolution of % A behaviours for the variable neighbourhood aggregated model for β = 29, gA=0.7, 5 neighbours and 4% initial A behaviours |

|
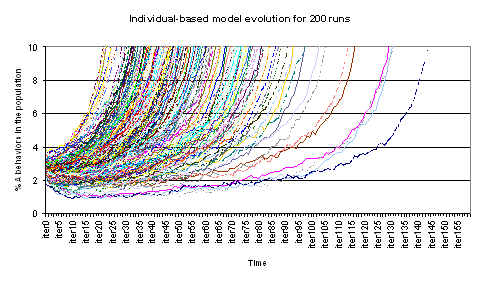
| Figure 7b. Details on the evolution of % A behaviours on time for the individual-based model for 200 runs for β = 29, gA=0.7, 5 neighbours and 4% initial A behaviours |

|
| Figure 8. Aggregated model potential function for β = 29, gA=0.7, 5 neighbours |
The potential function shows that the aggregated model cannot increase to 100 % of A behaviour when it begins with less than 5% of A behaviour (see the zoom on the right hand side), because it is caught in the potential minimum which appears in the zoom. The stochastic events taking place in the individual based model allow it to climb out and to join 100% of A behaviour.
BEN-NAIM, E., Krapivsky, P.L., Vazquez, K.F. and Redner S. (2003) Unity and discord in opinion dynamics. Physica A. 330(1-2): 99-106.
BLUME, L. (1993) The statistical mechanics of strategic interaction. Games and economic behaviour 4:387-424.
BLUME, L. (1995) The statistical mechanics of best-response strategy revision. Games and economic behaviour 11:111-145.
de ANGELIS, D.L., Gross, L.J. Editors (1992) Individual-based models and approaches in ecology, Chapman & Hall .
DUBOZ, R., Ramat, E., Preux, P. (2003) "Scale transfer modelling : using emergent computation for coupling an ordinary differential equation system with a reactive individual model". Systems Analysis Modelling Simulation, 43(6): 793-814.
EDWARDS, M., Huet, S., Goreaud, F., Deffuant, G. (2003a) Comparing individual-based model of behaviour diffusion with its mean field aggregated approximation. Journal of Artificial Societies and Social Simulation 6(4) https://www.jasss.org/6/4/9.html.
EDWARDS, M., Huet, S., Goreaud, F., Deffuant, G. (2003b) Comparaison entre un modèle individu-centré de diffusion de l'innovation et sa version agrégée dérivée par champ moyen pour des simulations à court terme. Actes du colloque Modèles Formels d'Interactions91-100, éditeurs: A. Herzig, B. Chaib-draa. Ph. Mathieu Cépaduès-éditions.
ELLISON, G. (1993) Learning, Social interaction, and coordination. Econometrica 61:1047-71.
EPSTEIN, J. and Axtell, R. (1996) Growing artificial societies: Social science from the bottom up. Cambridge Massachussetts, MIT Press.
FAHSE, L., Wissel, C., Grimm, V. (1998) Reconciling classical and individual-based approaches of theoretical population ecology: a protocol to extract population parameters from individual-based models. American Naturalist 152:838-852.
GILBERT, N., Troitzsch, K. G. (1999) Simulation for the social scientist Open University Press.
GRANOVETTER, M. (1978) Threshold models of collective behaviour. American Journal of Sociology 83:1360-1380.
GRIMM, V. (1999) Ten years of individual-based modelling in ecology: what we have learned and what could we learn in the future?, Ecological Modelling, 115:129-148.
KIRKPATRICK, S., Gelatt, C.D., Vecchi, M.P. (1983) Optimization by Simulated Annealing, Science, 220(4598):671-680.
LUCE, R.D. (1959) Individual Choice Behaviour: a Theoretical Analysis, 1979, Greenwood Press Reprint.
MORRIS, S. (1997) "Contagion". Working paper, Department of Economics, University of Pennsylvania.
PICARD, N. and Franc, A. (2001) Aggregation of an individual-based space-dependant model of forest dynamics into distribution-based and space-independant models, Ecological Modelling 145:68-84.
VALENTE, T.W. (1995) Network models of the diffusion of innovations. Cresskill, New Jersey: Hampton Press, Inc.
WEIDLICH, W. (2000) SocioDynamics: a Systematic Approach to Mathematical Modelling. Harwood.
WEIDLICH, W. (2002) Sociodynamics: a systematic approach to mathematical modelling in the social sciences. Nonlinear Phenomena in Complex Systems, 5(4): 479-487.
YOUNG, P. (1998) Individual Strategy and Social Structure, Princeton University Press.
YOUNG, P. (1999) Diffusion in Social Networks, Working Paper No 2., Brookings Institution.
Return to Contents of this issue
© Copyright Journal of Artificial Societies and Social Simulation, [2007]